Nice link Jimmy. I'll be giving that supertrend thing a go in MT.
Have to think the bottom is in though. I see some good buying in the SPX futures esp on Wednesday, which usually gives good base levels for a bottom.
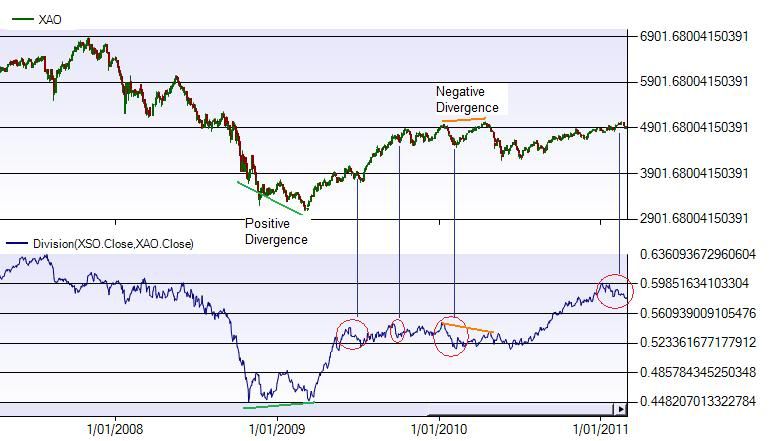
One thing I can put up today for the XJO peeps, is the XSO/XAO ratio chart, which Redbacka showed a fair bit.
So heres the chart with comments to follow...

So, first thing to mention is that as a ratio the actual levels are not so important, its more important to look at the rate of change, and compare to price itself.
So, I circled similar points in red, where the ratio comes off a peak. Usually the ratio moves with price, and can often fall before price falls.
I also marked green and orange lines where there was diveregence between price and the ratio. The green divergence shows the ratio with rising lows when price continues making lower lows. Everything then rallied strongly after the 3rd low in March 2009.
The orange divergence shows the ratio making a lower high, as price makes a higher high. This preceeded some fairly bearish action in the middle of 2010.
So, for now, we can see the ratio gave advanced warning of the falls of the last couple of weeks. It has been falling a fair bit, so the question is will the ratio get to new highs, or will it now draw out a lower high, as our market moves higher creating another negative divergence signal like last year.
- Forums
- ASX - By Stock
- XJO
- freakie friday
freakie friday, page-21
-
- There are more pages in this discussion • 13 more messages in this thread...
You’re viewing a single post only. To view the entire thread just sign in or Join Now (FREE)
Featured News
Add XJO (ASX) to my watchlist
 (20min delay) (20min delay)
|
|||||
|
Last
7,807.2 |
Change
-22.500(0.29%) |
Mkt cap ! n/a | |||
| Open | High | Low |
| 7,829.7 | 7,829.7 | 7,782.0 |
Featured News
| XJO (ASX) Chart |
The Watchlist
I88
INFINI RESOURCES LIMITED
Charles Armstrong, CEO
Charles Armstrong
CEO
SPONSORED BY The Market Online


