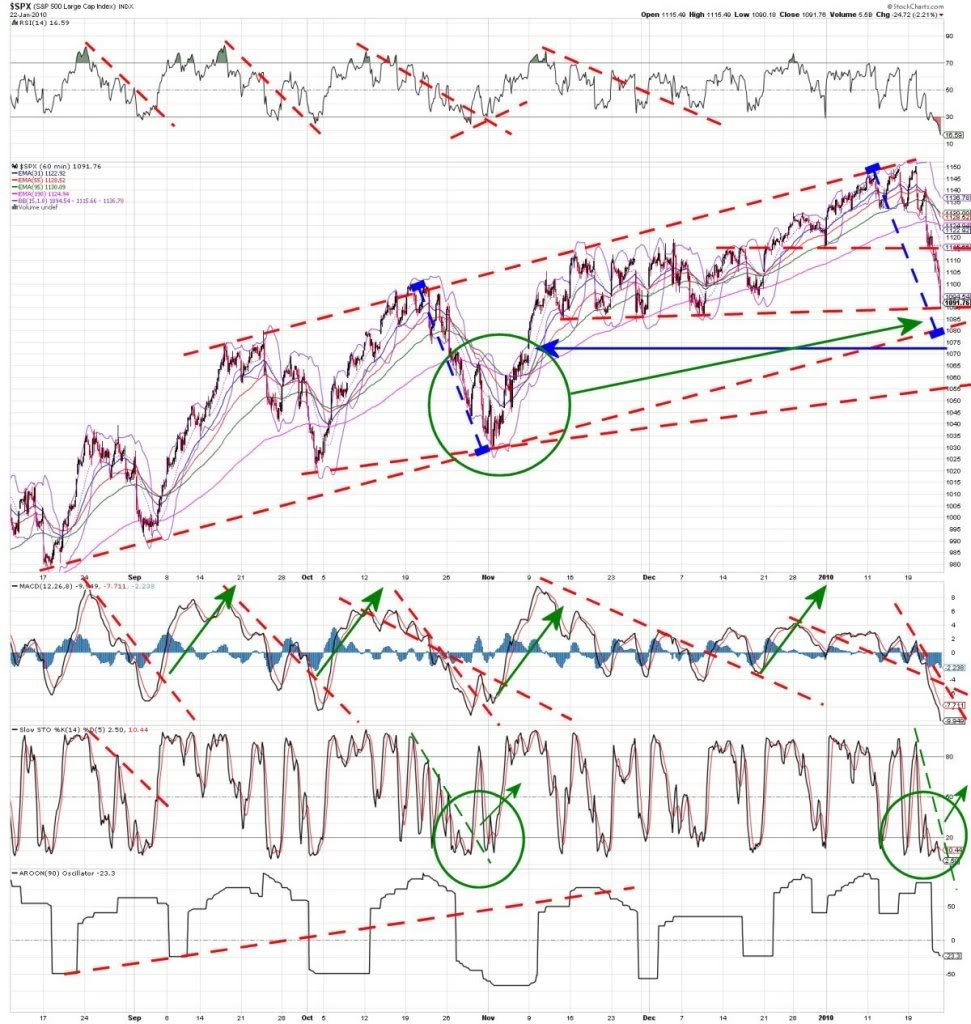
Alrighty then ... on a positve note ... (we know it could spell doom and gloom and all, but first it must rally to a lower high, on weaker MACD's and stochs) ...
SPX has hit an important support line.
Anyone else notice the gap on the SPX at 1070 (blue arrow)? It's now low enough for the MACD's to form a textbook Wink divergence following a quick 40pt rally from 1090 perhaps, then to close the gap??
This could have the MACD's and stoch's reset on the underlying upward trend still, and delay the inevitable a while longer ...
Down trends need to break 2 rules, so far it's only broken 1. Bigger heads and shoulders seem to be the order of the day for tops (note to self: there's plenty of these on HC it seems, but less on the charts).
Bad karma is stoch's rolling over below 50% (midpoint) for more downwards motion.
Mongo's blue lower trend line looks safe for now IMO. 4700 still a target. Watch your MACD's and stoch's for confirmation of possible future price action.
rgds,
pw
SPX hourly -
- Forums
- ASX - By Stock
- XJO
- friday frollics
friday frollics, page-178
-
-
- There are more pages in this discussion • 1 more message in this thread...
You’re viewing a single post only. To view the entire thread just sign in or Join Now (FREE)
Featured News
Add XJO (ASX) to my watchlist
 (20min delay) (20min delay)
|
|||||
|
Last
8,300.2 |
Change
15.000(0.18%) |
Mkt cap ! n/a | |||
| Open | High | Low |
| 8,285.2 | 8,317.7 | 8,244.3 |
Featured News
| XJO (ASX) Chart |


