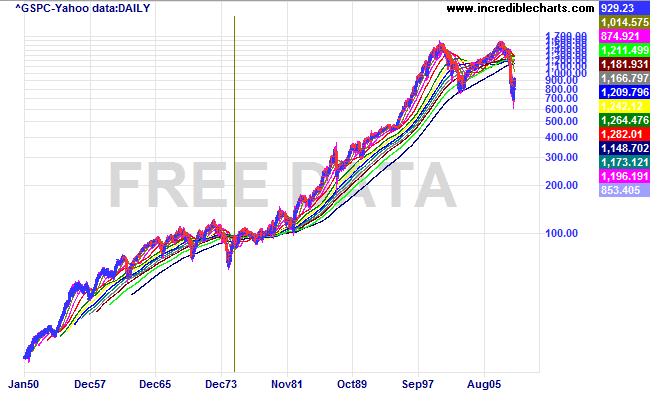
i continue to watch how my pitchfork plays out. imo, a break above would be a good sign that the march lows was it.
at the moment, this move could be viewed at a replica of may 2008, and the bulls need to prove otherwise.
if we bust above ....possibly suggests that we're still following the 1970s fractal???
below are my long timeframe mav. early last year, they started bunching together suggesting a collapse similar to 1973/74 high/low (that we got in spades). if we're following a similar move from 1974/75, price should head back to the point that foretold the potential for a price collapse......approx 1200-1280.
- Forums
- ASX - By Stock
- XJO
- friday night trading
friday night trading, page-132
Featured News
Add XJO (ASX) to my watchlist
 (20min delay) (20min delay)
|
|||||
|
Last
8,300.2 |
Change
15.000(0.18%) |
Mkt cap ! n/a | |||
| Open | High | Low |
| 8,285.2 | 8,317.7 | 8,244.3 |
Featured News
| XJO (ASX) Chart |


