Pete
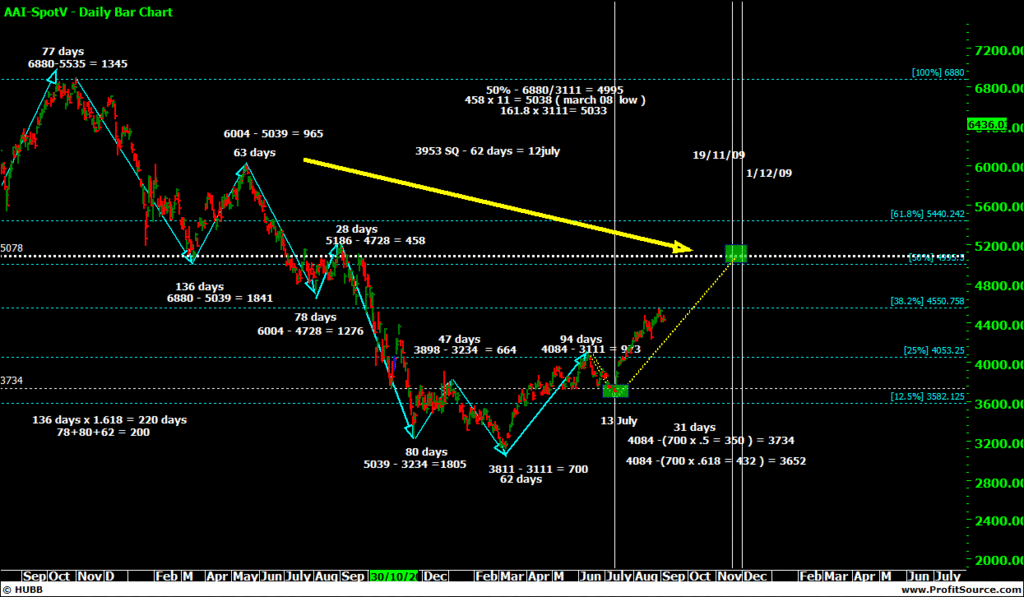
I like the historical stuff for the ranges, and thats in the good and bad times. If you remember I was suggesting a Nov 08 high of around the 5040 ish area. OK so I stuffed up the dates BIG TIME, however, but always knew the range could complete.
That's the old chart ( cant find the original that was done before the july low) I remember the time though as you were thinking like me and fighting them teddies with me :))
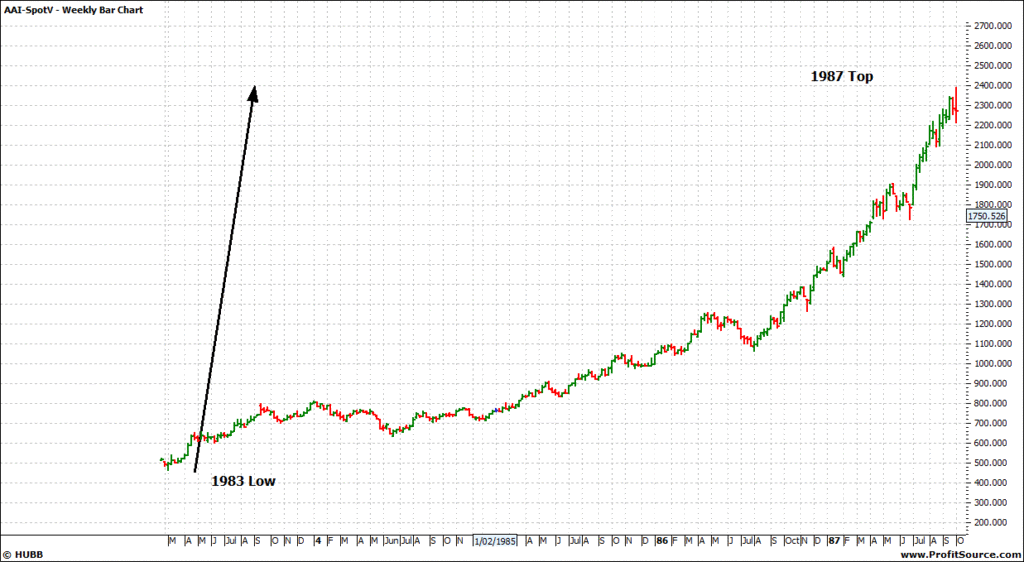
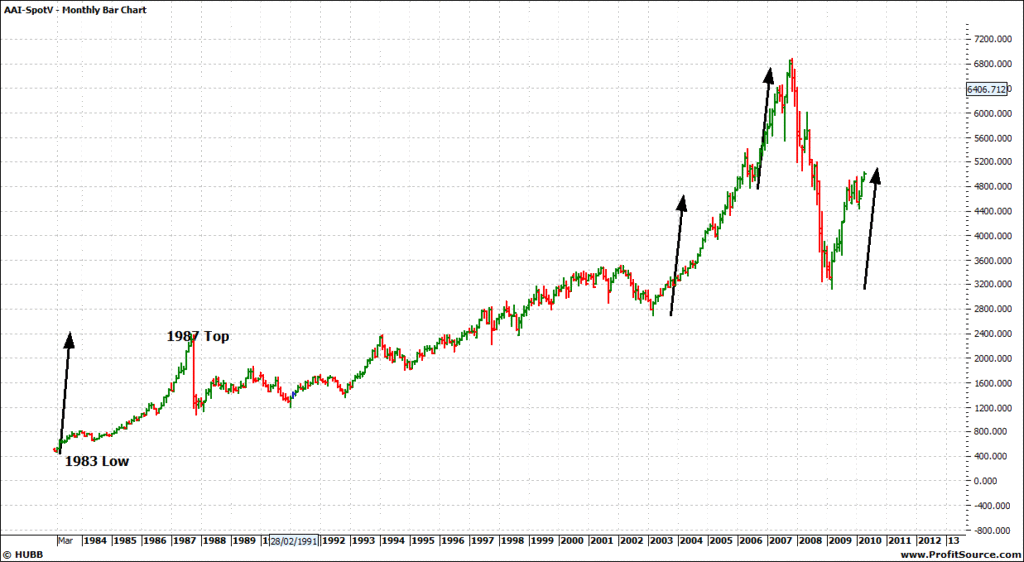
Part of the workings of the above dodgy forecasting was the 83 low to 87 high creating a range ( speed angle) which was 1929 points
Now that range IMO is worth noting for many years ahead since and even going forward from here.
The high this week on SPI was 5037 ??
So 5037 - 3111 ( mar 08 low) = 1926 points.
Maybe its nothing, but its definitely worth noting ?
Now if the 5037 was hit in Nov 09, I would be a lot more bullish now and not have been a bit shy over the last month or so. as the structure of the index would have looked a lot nicer.
Ill find something to buy or sell next week though LOL, as I think all the above is fun in aiding the sharpening of the tools.
Regards
Rob
- Forums
- ASX - By Stock
- XJO
- friday trading
friday trading, page-131
-
- There are more pages in this discussion • 54 more messages in this thread...
You’re viewing a single post only. To view the entire thread just sign in or Join Now (FREE)
Featured News
Add XJO (ASX) to my watchlist
 (20min delay) (20min delay)
|
|||||
|
Last
8,295.1 |
Change
68.800(0.84%) |
Mkt cap ! n/a | |||
| Open | High | Low |
| 8,226.3 | 8,319.4 | 8,226.3 |
Featured News
| XJO (ASX) Chart |
The Watchlist
EQN
EQUINOX RESOURCES LIMITED.
Zac Komur, MD & CEO
Zac Komur
MD & CEO
SPONSORED BY The Market Online


