Zanzibar,
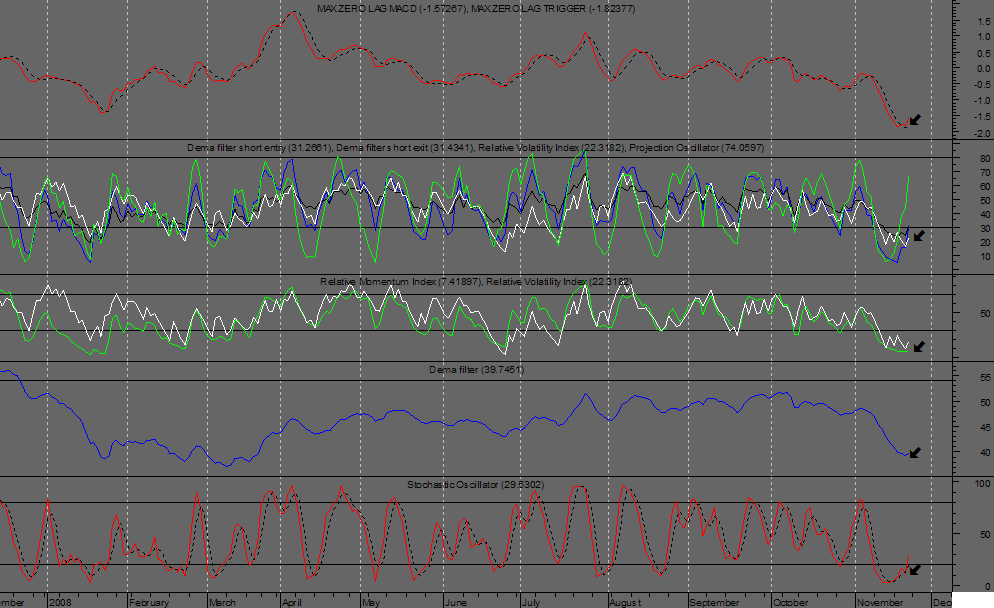
That didn't load right try this...lol ..its Friday..
Thx..I hear what you are saying..
I am a Bull through & through and I am still not 100%convinced on today's rally..
I do hope like hell it is the real one.
But a bounce in no mans land (NOT A FIB IN SIGHT)is hard to believe.. imo
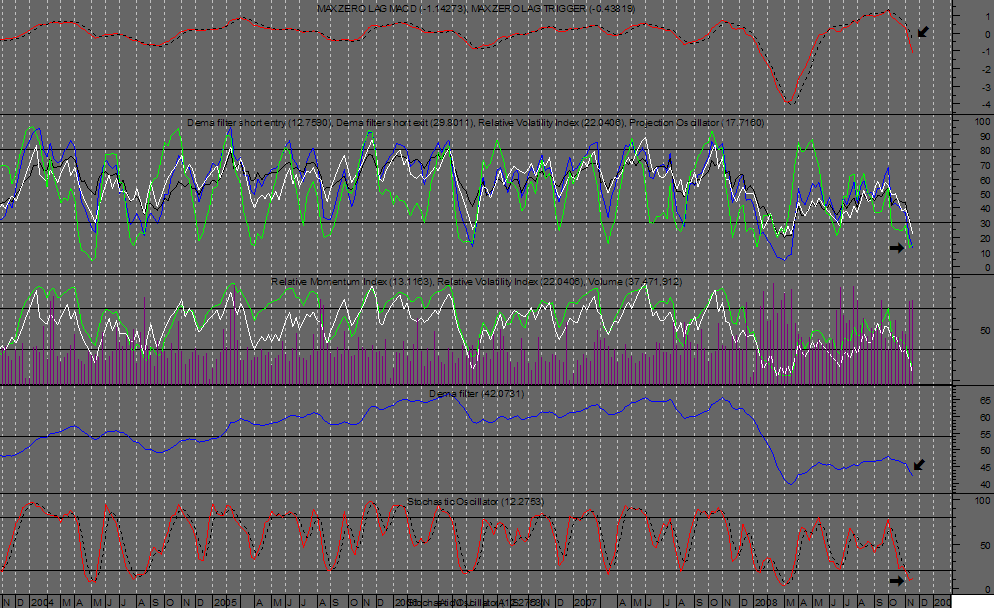
Even though over the last couple of days I've thinking that the Banks had been trying to give out bottom signals..
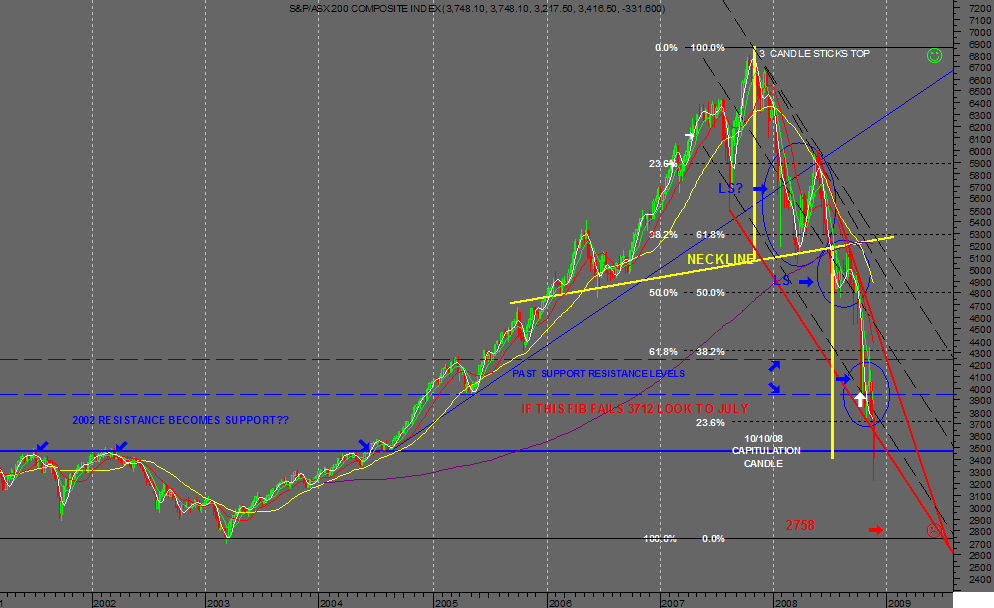
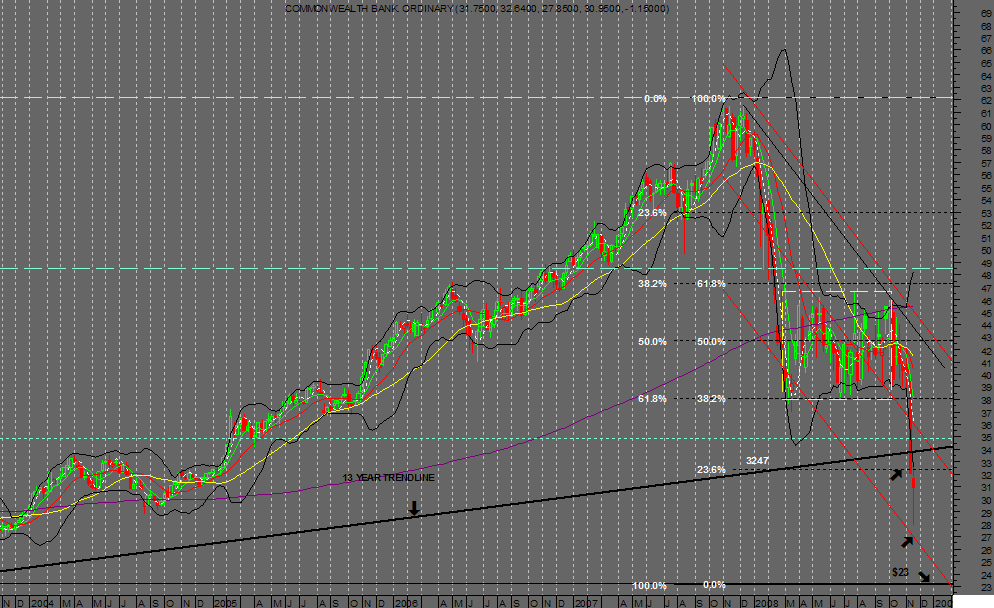
Just had another look at the chart and noticed 2001/2002 old resistance levels which should be support levels so was this a trade through.??
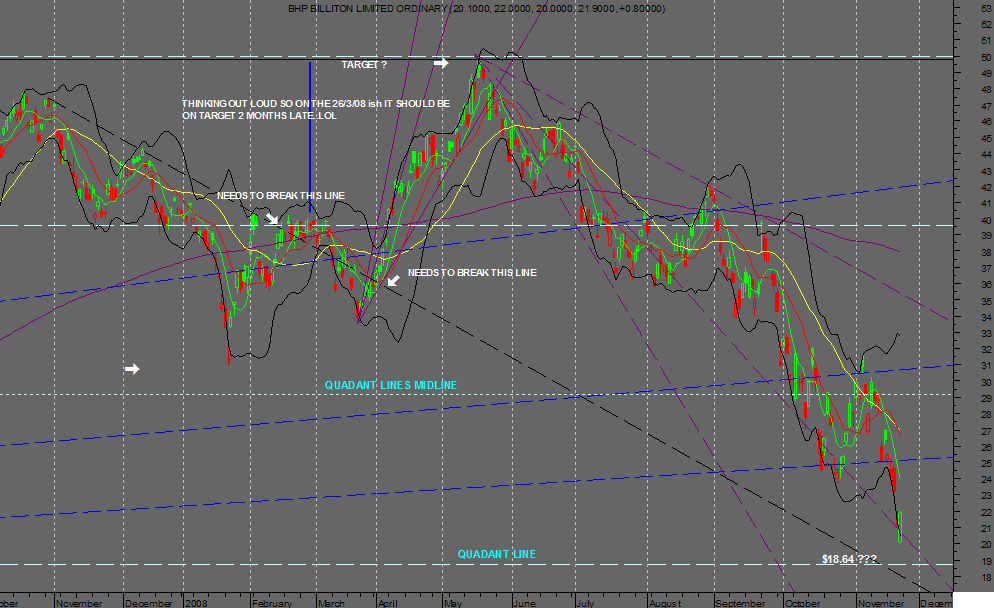
I'm thinking it may have been due to physiological levels where being hit e.g. $20 BHP $30 CBA even though CBA was well outside the weekly bollingers looking cheap..note Ma's etc..chuck in a bit of Dow anticipation... wholla a rally..
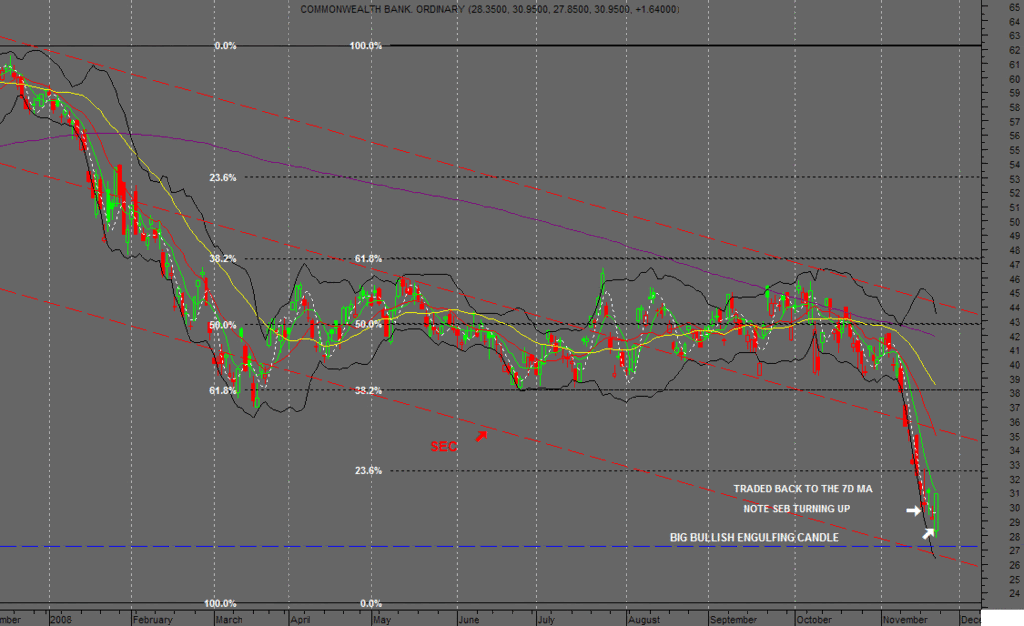
I have 2758 possible XJO low, $18 low BHP on a pretty good fib chart if I might say so & around $23 for CBA but they can go the either way and trade back to the last fib its not far away..whats the go, good question ???? imo..
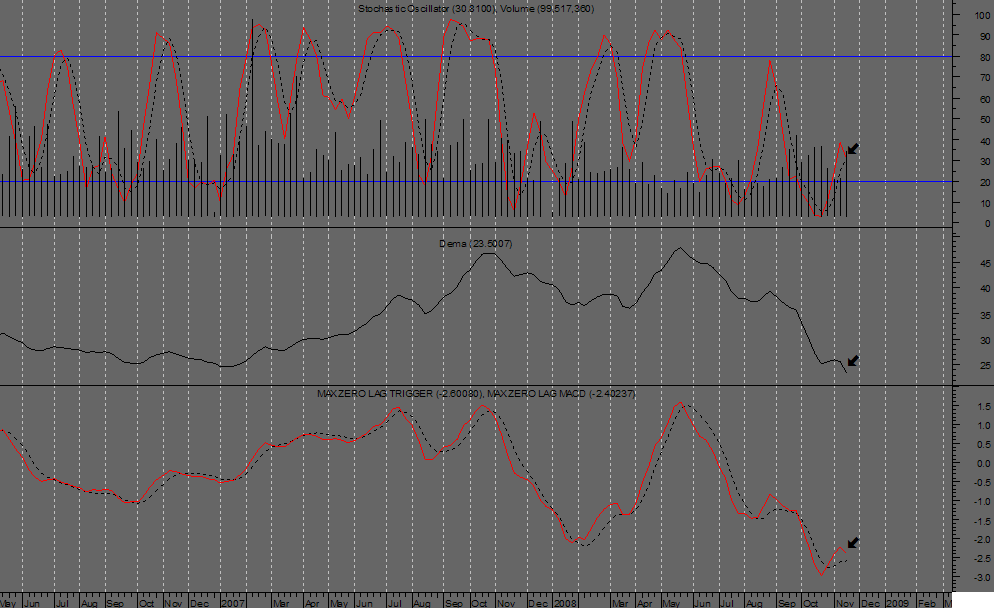
CBA's Daily chart is the most promising for a bounce check the Inds and Candles..
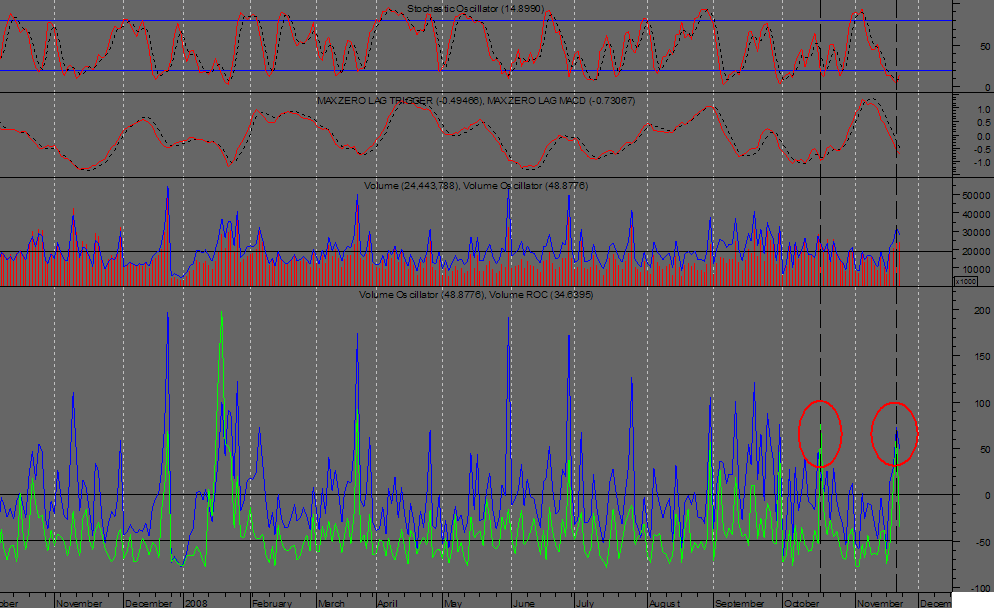
Note BHP's VOLUMES ROC & OSC
I know its a bit unfair using 2 examples but look at the charts are the banks going to save us, or are the resource's going to take us to the next low...????
Then I could just have it all wrong it wouldn't be the first time by a long shot..
Cheers Pete..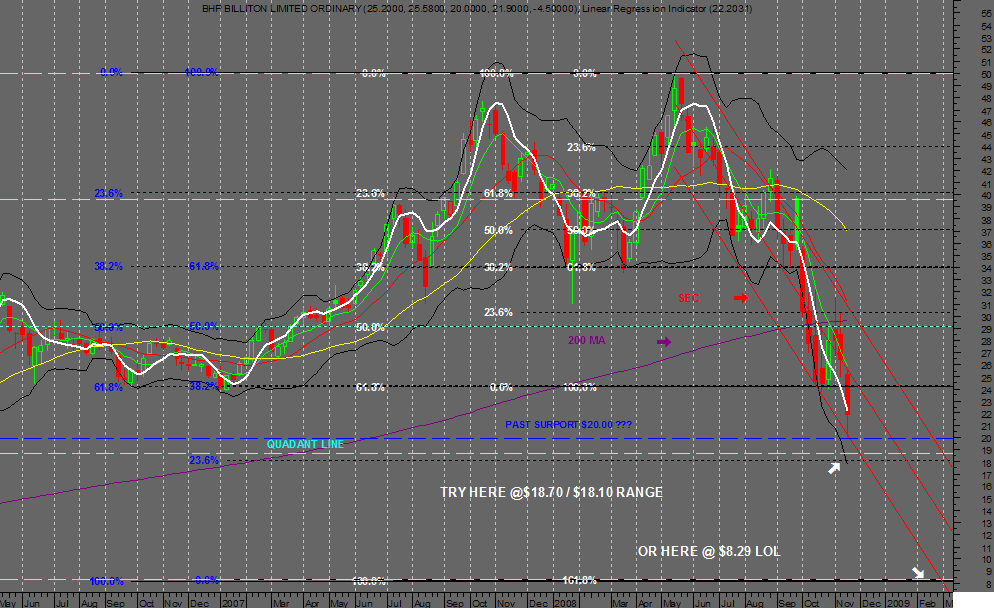
- Forums
- ASX - By Stock
- XJO
- friday trading
friday trading, page-212
Featured News
Add XJO (ASX) to my watchlist
 (20min delay) (20min delay)
|
|||||
|
Last
8,224.0 |
Change
30.600(0.37%) |
Mkt cap ! n/a | |||
| Open | High | Low |
| 8,193.4 | 8,239.4 | 8,193.4 |
Featured News
| XJO (ASX) Chart |
