The geometry of the charts never ceases to amaze me. Who thinks this stuff up ??
The more I study the chart the more I realize that the last 20 years was all a mathematical product of the 87 high. All the way up and all the way back down the only substantial chart support is at multiples of the 87 high. As discussed yesterday we are now at 3x support but i just realized this morning that the first low close on the current "plateau" , as marked on my chart, was EXACTLY TO THE POINT 3 times the 87 high. since then we have had one false break below the line and an unimpressive second high. We are heading back to the line and if close below it then, IMO, it's lights out. If history repeats we should head straight through 5454 and rebound to find support there. As mentioned earlier this will be 2x the 87 high but it is also exactly a 61.8% fall from the 2007 top.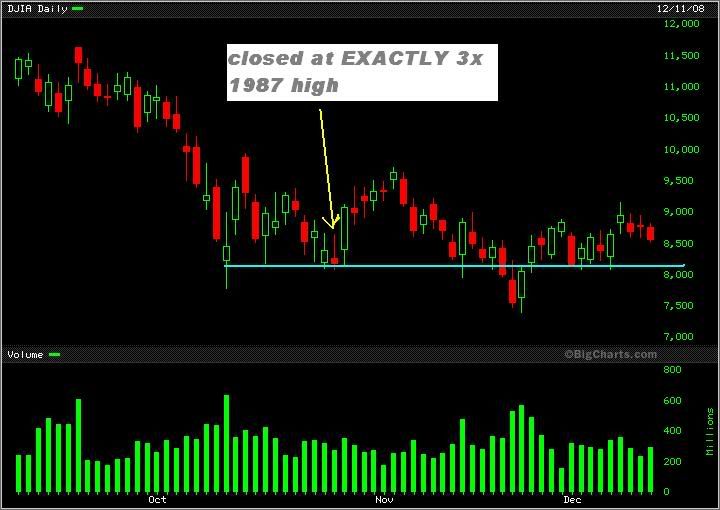
friday trading, page-32


Add XJO (ASX) to my watchlist
 (20min delay) (20min delay)
|
|||||
|
Last
8,216.7 |
Change
11.300(0.14%) |
Mkt cap ! n/a | |||
| Open | High | Low |
| 8,205.4 | 8,219.4 | 8,189.2 |
| XJO (ASX) Chart |