Hi guys thanks for all your support, much appericated.
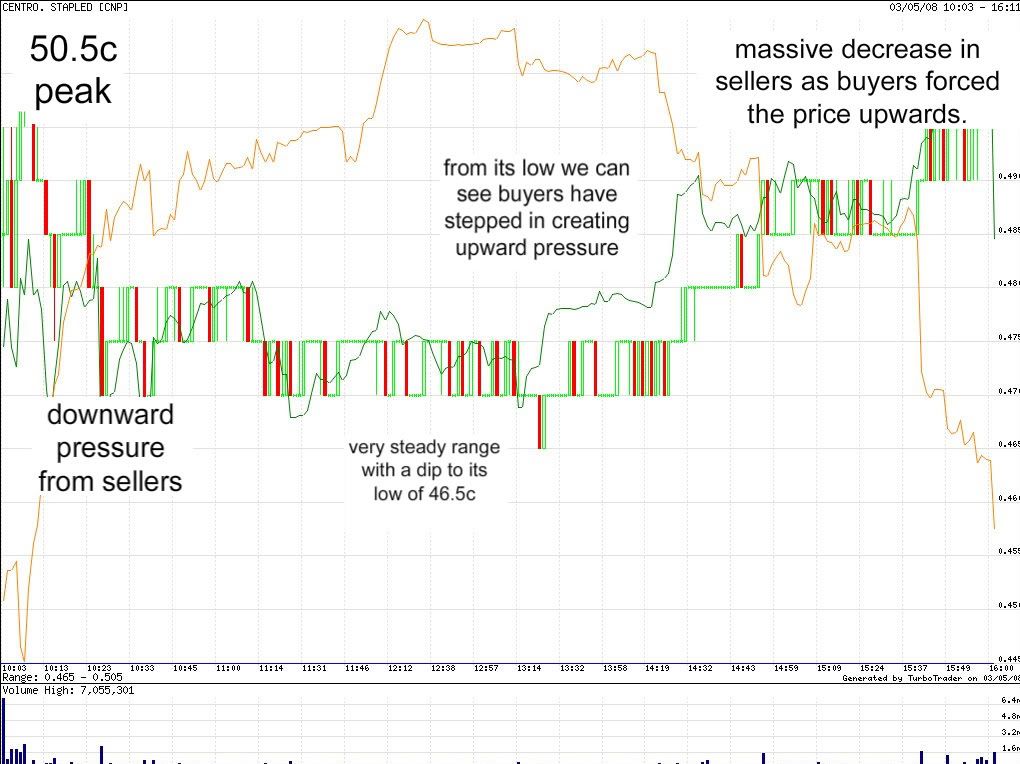
This chart is from turbo trader. The green line represents the total amount of buyers at any given point int time, and the yellow line is the sellers.
having started with more buyers than sellers we saw the price rise to 50.5c, but as you can see shortly after open there was a very steady increase in sellers. This downward pressure lasted to around about 11.14am in whichwe saw the SP find a steady base and only dipped to its low at 13.20.
It was having hitting bottom at 13.20 for the day we seen the increase in buyers take place, which leads the way to back up to 50c and a close of 49.5c.
Also notice the volume was mainly in the first session and last sessions of trade.
- Forums
- ASX - By Stock
- CNP
- fridays charts
fridays charts
-
-
- There are more pages in this discussion • 14 more messages in this thread...
You’re viewing a single post only. To view the entire thread just sign in or Join Now (FREE)
Featured News
Add CNP (ASX) to my watchlist
Currently unlisted public company.
The Watchlist
LU7
LITHIUM UNIVERSE LIMITED
Alex Hanly, CEO
Alex Hanly
CEO
SPONSORED BY The Market Online


