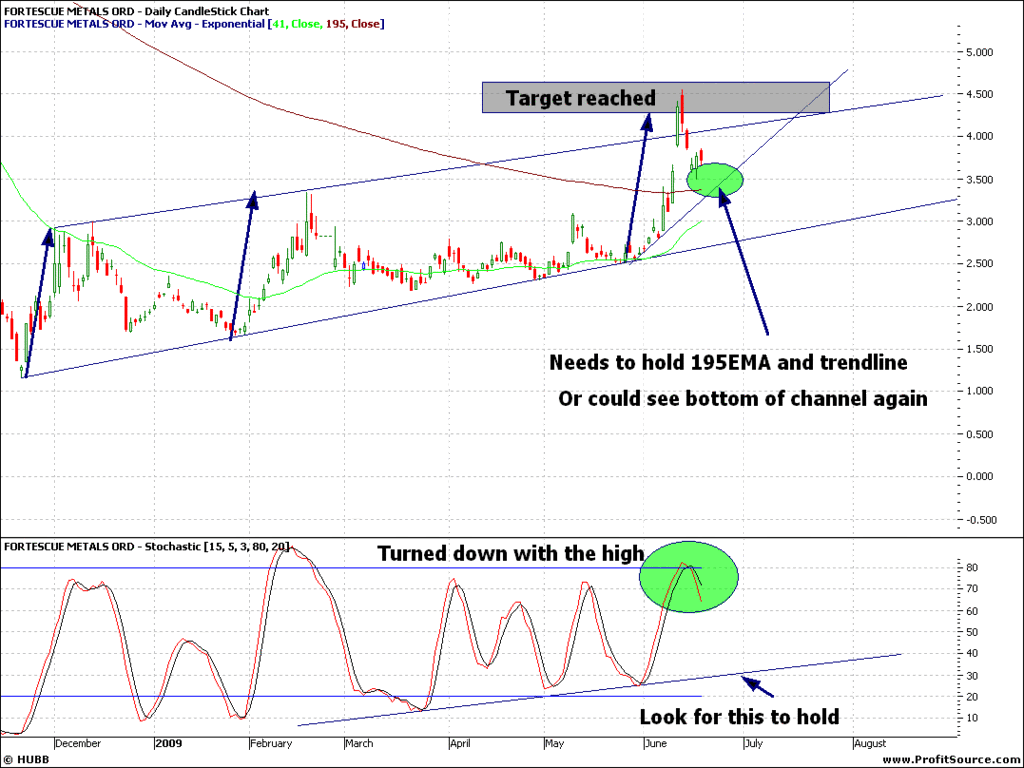
Here is a chart:
FMG
Daily:
You can see it was traveling in an upwards trending channel, with some repeating speed angles (arrows). It managed to break away from the channel, and reach the target on the speed angle. This is when I advised my poppy to sell, due to stochastics being overbought and starting to turn there.
Now we have seen a pullback into the channel with the stochastics turning down. Look for it to either hold the upwards sloping line and the 195EMA for support (pretty much go sideways for a bit), while the stochastic falls, Or it may break its trendline and the 195EMA and fall back down to the lower channel support.
Also keep and eye on the stochastic on that trendline if it turns up there on support.
- Forums
- ASX - By Stock
- FMG
- fridays open
fridays open, page-23
-
-
- There are more pages in this discussion • 49 more messages in this thread...
You’re viewing a single post only. To view the entire thread just sign in or Join Now (FREE)
Featured News
Add FMG (ASX) to my watchlist
 (20min delay) (20min delay)
|
|||||
|
Last
$19.55 |
Change
0.050(0.26%) |
Mkt cap ! $60.19B | |||
| Open | High | Low | Value | Volume |
| $19.98 | $20.30 | $19.51 | $184.3M | 9.305M |
Buyers (Bids)
| No. | Vol. | Price($) |
|---|---|---|
| 5 | 2568 | $19.51 |
Sellers (Offers)
| Price($) | Vol. | No. |
|---|---|---|
| $19.56 | 44282 | 3 |
View Market Depth
| No. | Vol. | Price($) |
|---|---|---|
| 1 | 400 | 19.510 |
| 20 | 7251 | 19.500 |
| 1 | 100 | 19.490 |
| 4 | 5025 | 19.480 |
| 1 | 25 | 19.470 |
| Price($) | Vol. | No. |
|---|---|---|
| 19.670 | 4208 | 1 |
| 19.720 | 7073 | 2 |
| 19.730 | 10510 | 3 |
| 19.750 | 1496 | 1 |
| 19.760 | 1000 | 1 |
| Last trade - 16.10pm 08/11/2024 (20 minute delay) ? |
Featured News
| FMG (ASX) Chart |
The Watchlist
EQN
EQUINOX RESOURCES LIMITED.
Zac Komur, MD & CEO
Zac Komur
MD & CEO
SPONSORED BY The Market Online


