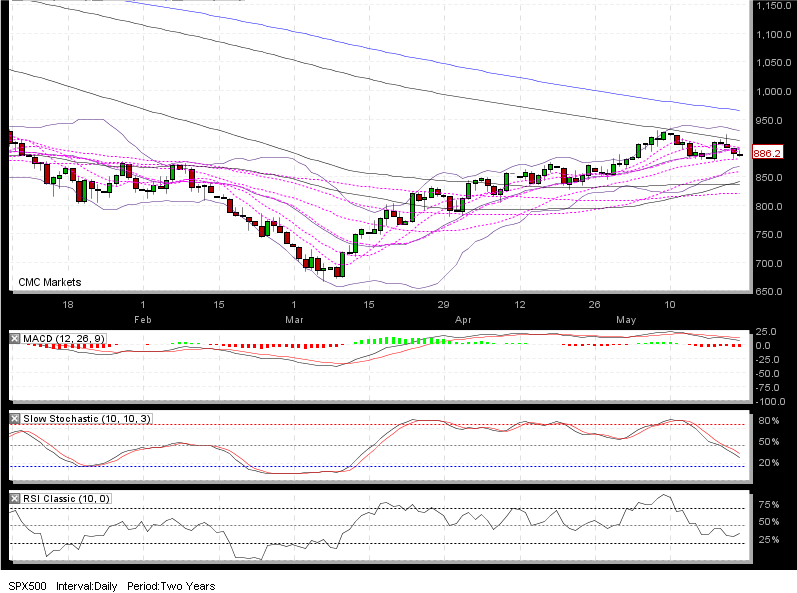
just a simple daily chart - slow stoch and rsi have been trending down since 8th of may high. daily and weekly support at around 835, which i suspect we'll see next week.
by then, slow stoch and rsi should be within a range that supports a decent corrective bounce.
- Forums
- ASX - By Stock
- friday's stage set
just a simple daily chart - slow stoch and rsi have been...
-
- There are more pages in this discussion • 76 more messages in this thread...
You’re viewing a single post only. To view the entire thread just sign in or Join Now (FREE)
Featured News
Add XJO (ASX) to my watchlist
 (20min delay) (20min delay)
|
|||||
|
Last
7,763.8 |
Change
-75.000(0.96%) |
Mkt cap ! n/a | |||
| Open | High | Low |
| 7,838.8 | 7,838.8 | 7,750.5 |
Featured News
| XJO (ASX) Chart |


