I chucked up 3 US charts on Wednesday suggesting it was 'probably' a good time to short the market. A couple of nice drops since, most significantly 203pt DJ drop overnight. Just lucky? Perhaps. I like to call it professionalism, lol. Hopefully makes up for me trying to short the market a couple of months ago. 'I think' it's now appearing pretty obvious the market is starting to teeter, but you do need to take the first day of the quarter with a grain of salt.
----------
A re-cap from Wednesday Cycle Analysis suggested:
DJIA - signal crossed, suggesting possible time to short market.
SP500 - signal crossed, suggesting possible time to short market.
Nasdaq - signal crossed, suggesting possible time to short market.
XJO - signal not yet crossed.
----------
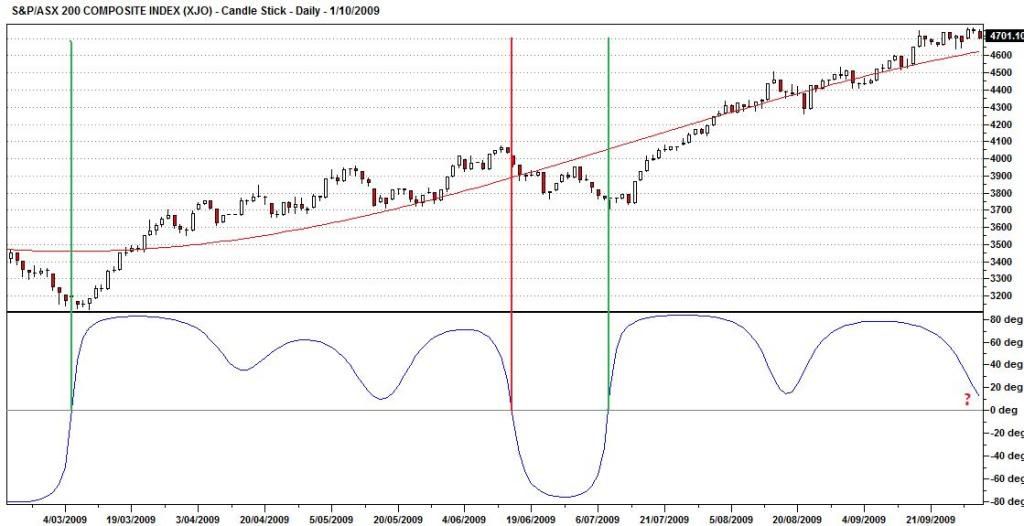
Another updated chart below - this time of the Aussie XJO. As you can see, going by yesterday's EOD data the wave still hasn't crossed. However, as the chart is dynamic I'm reasonably confident the signal will be crossed after today's action, providing that prized short/sell signal on the Aussie market. A reminder, these charts purely based on prior time cycles, no future predictions - the signals can also change direction quickly.
The chart suggestions below;
* Green = Long
* Red = Short
- Forums
- ASX - By Stock
- XJO
- fruitful friday
fruitful friday
-
- There are more pages in this discussion • 12 more messages in this thread...
You’re viewing a single post only. To view the entire thread just sign in or Join Now (FREE)
Featured News
Add XJO (ASX) to my watchlist
 (20min delay) (20min delay)
|
|||||
|
Last
8,013.4 |
Change
31.000(0.39%) |
Mkt cap ! n/a | |||
| Open | High | Low |
| 7,982.4 | 8,030.3 | 7,982.4 |
Featured News
| XJO (ASX) Chart |


