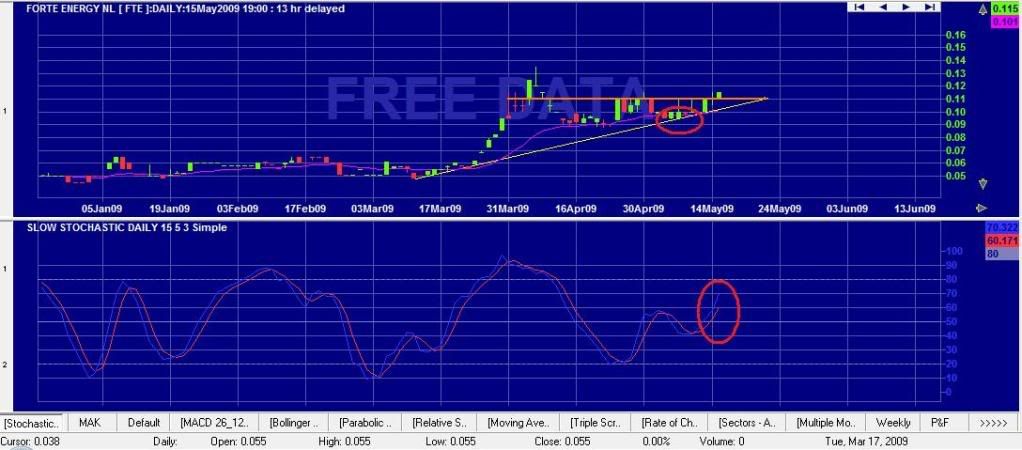
here is another chart displaying the stochastic along with a 21 day moving average and price. you will note the red circles highlighting the bounce of the 21 day moving average along with the rising slow stochastic. its been good to see it close above 11c on friday, although the only thing missing is an increased volume.