Oh well, you can see what we were aiming for.
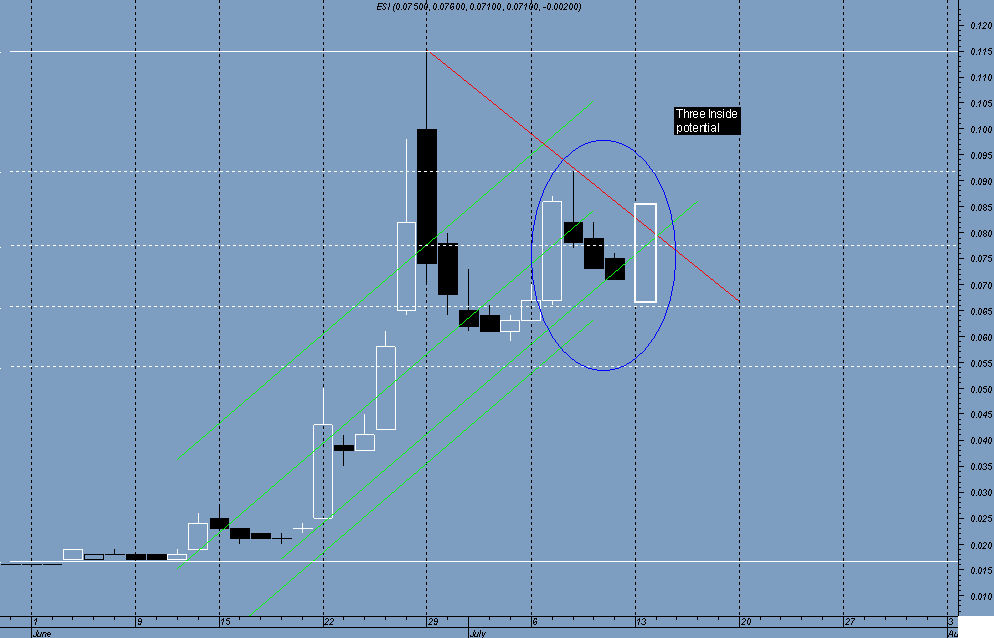
Problem is, as far as overall market sentiment contributes to the chart patterns fulfillment , we are still in a possible Bear Trap and not a bull market...this pattern is a bullish continuation
check it out here
Bullish rising three secrets
remember that and now look at our chart....and previous estimates, I dont think the ESI trend is bearish ...
constructive critisism always very welcome
cheers.
gap and breakout levels..charts, page-27


Add ECT (ASX) to my watchlist
 (20min delay) (20min delay)
|
|||||
|
Last
0.3¢ |
Change
0.000(0.00%) |
Mkt cap ! $9.515M | |||
| Open | High | Low | Value | Volume |
| 0.3¢ | 0.3¢ | 0.3¢ | $739 | 261.1K |
Buyers (Bids)
| No. | Vol. | Price($) |
|---|---|---|
| 39 | 27014353 | 0.2¢ |
Sellers (Offers)
| Price($) | Vol. | No. |
|---|---|---|
| 0.3¢ | 5066937 | 5 |
View Market Depth
| Last trade - 15.59pm 29/07/2024 (20 minute delay) ? |
| ECT (ASX) Chart |