- Forums
- ASX - By Stock
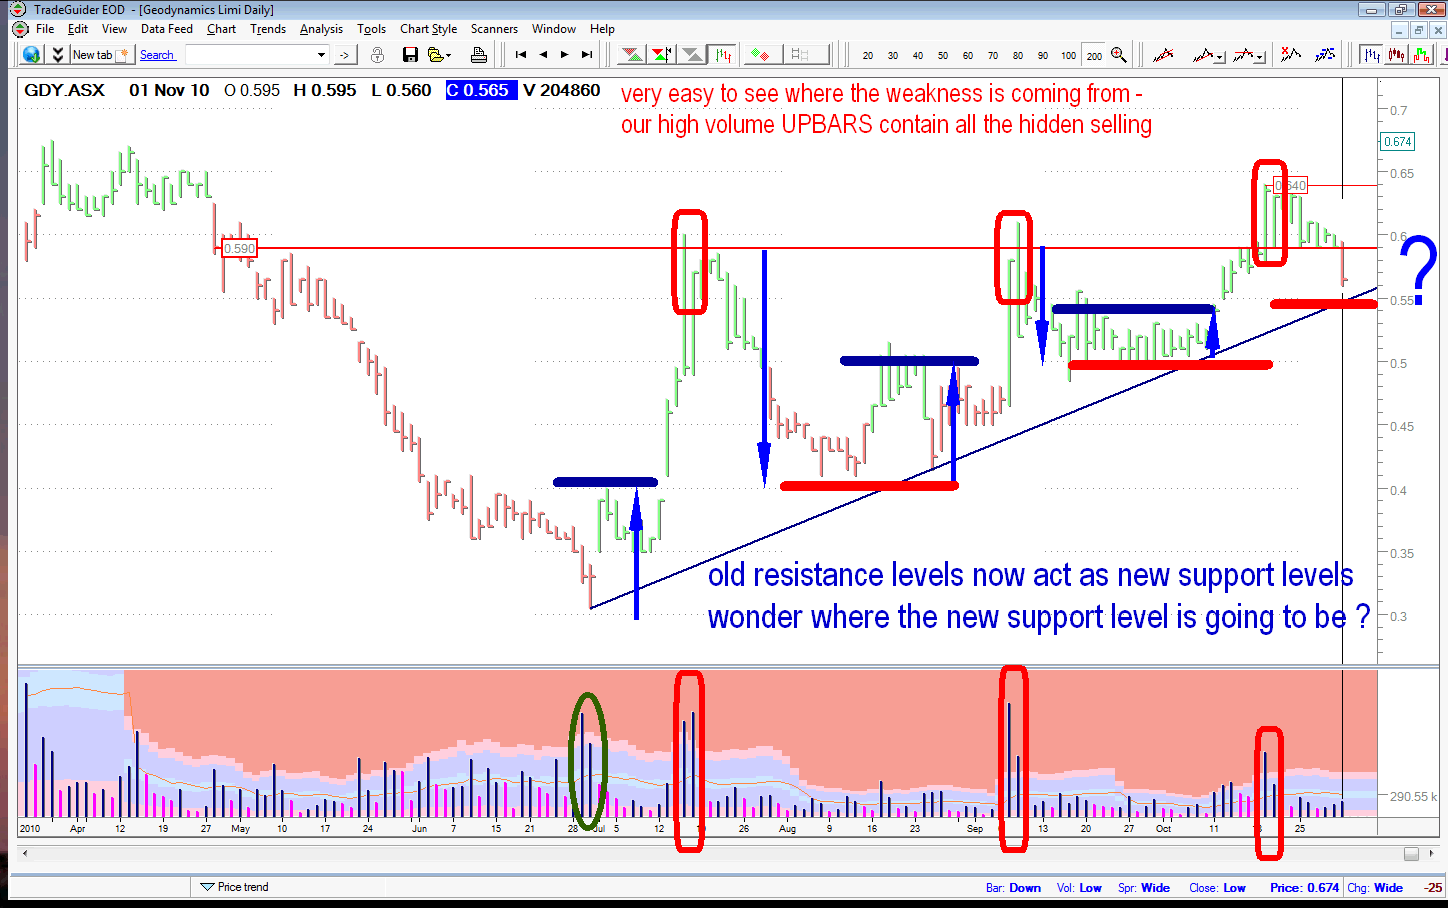
- gdy 01nov chart
an updated short term chart for GDY clearly showing where the...
-
- There are more pages in this discussion • 20 more messages in this thread...
You’re viewing a single post only. To view the entire thread just sign in or Join Now (FREE)
Featured News
NEWS
Is oil undervalued?
Add RNE (ASX) to my watchlist
 (20min delay) (20min delay)
|
|||||
|
Last
0.4¢ |
Change
0.000(0.00%) |
Mkt cap ! $2.904M | |||
| Open | High | Low | Value | Volume |
| 0.3¢ | 0.4¢ | 0.3¢ | $428 | 107.7K |
Buyers (Bids)
| No. | Vol. | Price($) |
|---|---|---|
| 19 | 5951596 | 0.3¢ |
Sellers (Offers)
| Price($) | Vol. | No. |
|---|---|---|
| 0.4¢ | 4536905 | 6 |
View Market Depth
| No. | Vol. | Price($) |
|---|---|---|
| 19 | 5951596 | 0.003 |
| 15 | 7822162 | 0.002 |
| 11 | 16348926 | 0.001 |
| 0 | 0 | 0.000 |
| 0 | 0 | 0.000 |
| Price($) | Vol. | No. |
|---|---|---|
| 0.004 | 4536905 | 6 |
| 0.005 | 4134111 | 8 |
| 0.006 | 4507550 | 4 |
| 0.007 | 894338 | 3 |
| 0.008 | 850657 | 5 |
| Last trade - 16.10pm 06/08/2024 (20 minute delay) ? |
Featured News
| RNE (ASX) Chart |


