Buffet Indicator Sends Stock Warning
Warren Buffet’s favorite market indicator is sounding the alarm. Comparing the stock market’s total value to the overall size of the economy, the Buffet Indicator is signaling that stocks are overvalued and could crash. Experts are advising to follow the lead of billionaires and cash out of the market before it is too late. Many Americans are now crash-proofing their portfolios with safe haven assets like physical gold and silver.
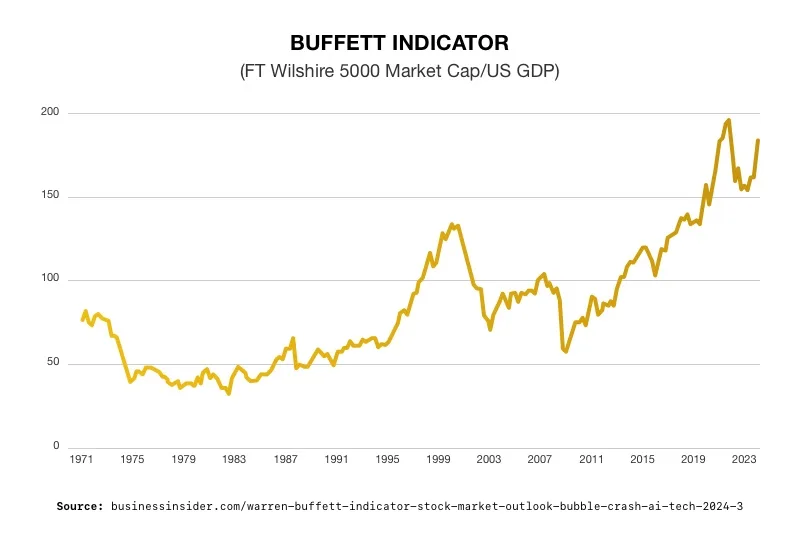
Warren Buffet said his namesake indicator was “probably the best single measure of where valuations stand at any given moment.” A reading of 100% means stocks are fairly valued. An indicator of 70% means stocks are in bargain territory. And anything approaching 200% is “playing with fire.” Right now, the Buffet Indicator is at a 2-year high of 184%.1
The Buffet Indicator takes the combined market capitalization of all actively traded US stocks and divides that figure by the latest quarterly estimate for gross domestic product (GDP).
A high percentage in the Buffett Indicator suggests that the total value of all publicly traded stocks is relatively high compared to the size of the economy as measured by GDP. This can indicate that stocks are overvalued relative to the underlying economic fundamentals.
It implies that investors are paying a high price for each unit of economic output generated by companies. This may signal that stock prices have become disconnected from the underlying fundamentals of the economy. Stock prices no longer reflect corporate earnings, revenue growth, and economic productivity.
Proven Track Record
Historically, periods of elevated Buffett Indicator levels have often been followed by market downturns. Investors realized that stock prices have become inflated and unsustainable.
The indicator hit a record high right before the dot-com bubble burst. By March 2000, at the peak of the dot-com bubble, the Buffett Indicator in the United States had climbed to around 148%. The total market capitalization of U.S. stocks was 1.48 times the country’s GDP. This elevated ratio was a clear indication of extreme overvaluation. The dot-com bubble burst and a significant market downturn followed. Buffett’s yardstick proved its worth at the start of 2022. It flashed red by surging past 200%. The S&P 500 and tech-heavy Nasdaq Composite plunged 19% and 33% respectively within the next 12 months.2
The Indicator Today
The indicator is based on the FT Wilshire 5000 and the GDP. The FT Wilshire 5000 Total Market Index is a widely followed index that tracks the performance of the entire U.S. stock market. It has jumped 9% to a record high this year. Market capitalization has increased more than $50 trillion. The surge is primarily driven by AI-related stocks and hopes for a cut in interest rates.
US GDP was $27.94 trillion last quarter. Dividing the FT Wilshire by the GDP results in a Buffet Indicator reading of 184%.
 3
3
Experts Weigh In
Paul Dietrich is the B. Riley Wealth Management’s chief investment strategist. He warned the S&P 500 may sink to its lowest level since the pandemic crash as overstretched stocks fall and a recession sets in.
Dietrich urged investors resist the ‘fear of missing out’ on the current stock rally. He advised against putting money into the market now. According to him, stocks often surge before a recession hits. They hit record levels based on emotion and momentum instead of earnings or growth. As a result, bubbles pop suddenly, and prices plummet quickly.
Dietrich pointed out that Warren Buffett’s own Berkshire Hathaway is heeding the namesake indicator. They have amassed a record $168 billion in cash and liquid assets. Other leaders such as Bezos, Zuckerberg, and Dimon are alsounloading their stock positions.
He remains confident that a recession is in the future. Dietrich calculates that even a mild recession could result in almost a 50% loss of stock market value.4
Market guru Gary Shilling shares this negative outlook. He gained recognition for correctly forecasting major economic events. He called the stagflation of the 1970s, the Japanese economic bubble in the 1980s, and the global financial crisis of 2008.
Shilling affirmed that stocks are historically overvalued. He cites the Shiller price-earnings ratio being 45% higher than normal. The massive concentration of the market surge in just a handful of stocks is another red flag. It shows how vulnerable the economy is. It suggests investors “really don’t like the rest of the stock market and therefore the bulk of the economy.”5
Shilling said stocks may crash 30% or more and a recession could hit within months. The past seven recessions struck an average of 26 months after the Fed began raising rates. Since it has been two years from the first rate hike, the economy is due for a downturn.
Conclusion
Warren Buffet’s favorite indicator is demonstrating what market experts have been saying for months – that this current stock market bubble cannot last. And there will be drastic consequences when it bursts. Americans looking to protect the value of stock-based retirement plans are shifting a portion of their portfolios into real safe haven assets like physical precious metals. Gold and silver in aGold IRAcan retain their value when the stock market crashes.


