This Could Be The Next Big Gold Trade
During my twelve years of trading virtually every financial market and instrument imaginable, I have learned that the best trades are anticipated and prepared for days, weeks, and sometimes months in advance. Moreover, the best trading setups occur when multiple indicators/factors come into alignment like stars in the sky.
Gold has been mired in a sloppy trading range ($1160-$1230) for the last few months that has surely confounded trend followers and market timers alike. However, conditions could be ripening for a powerful long trade in the shiny yellow metal, which could trigger at some point over the coming weeks. Two key factors are on the verge of aligning simultaneously; meanwhile, a 3rd factor helps to add weight to the overall setup. Needless to say, if the stars were to align for gold over the coming weeks, it would offer a very attractive BUY setup:
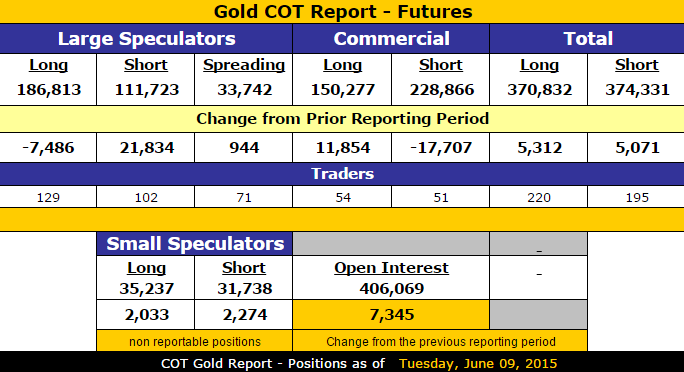
- Last week’s Commitments of Traders Report from the CFTC showed the first aggressive liquidation of speculative long positions in gold futures since March:
While a 29,000+ contract liquidation by large specs is quite aggressive, the overall net speculative length is still not quite at an extreme level, which has coincided with previous tradeable lows:
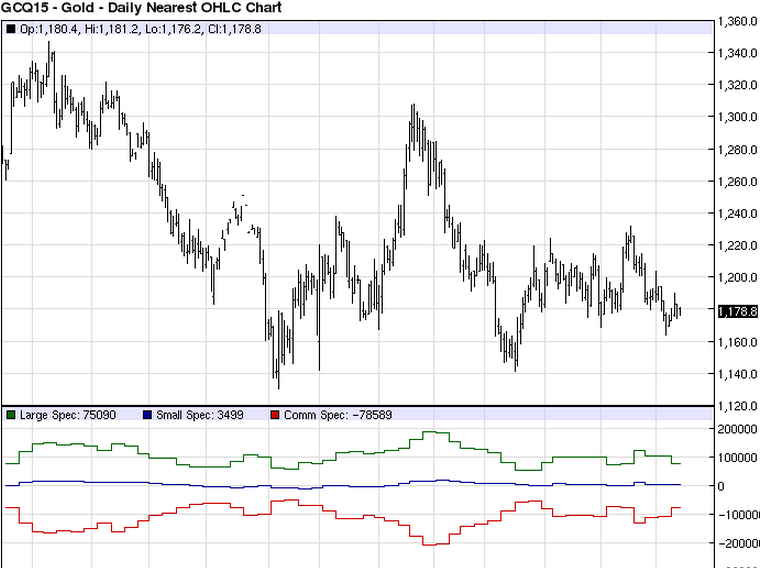
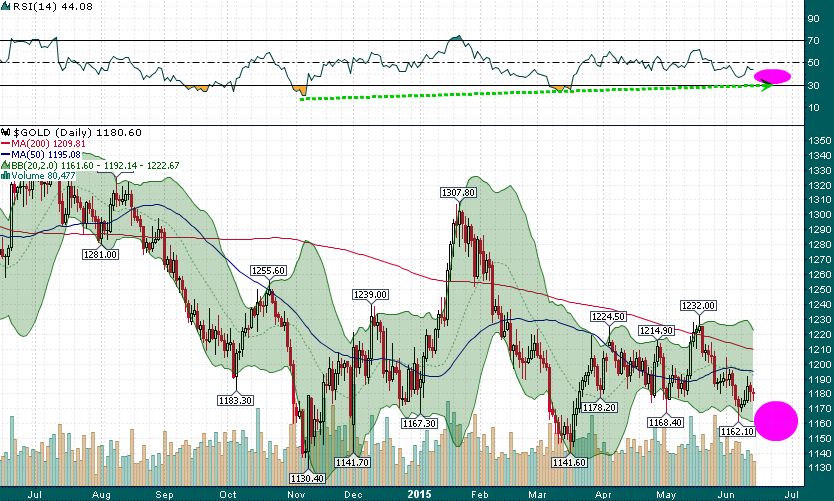
Gold (Daily with COT positioning below)
Gold Daily with COT Positioning
Another COT buy signal imminent?
Both the November 2014 and March 2015 lows saw large speculator net length fall below 60,000 contracts. Some additional liquidation by speculators over the coming weeks could bring the net speculative length back to levels that we have seen at previous lows. In my estimation, this would be made even more significant from a long term perspective if it were to take place at a higher level than the March low ($1141.60).
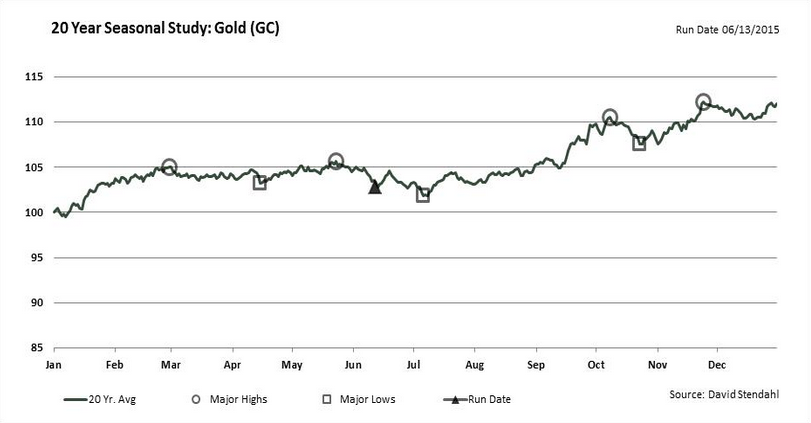
- By far the most powerful seasonal trend in gold is the late summer/early fall rally
Gold has often put in a major low during the month of July, and rallied through the end of September (and sometimes into October). There are many factors that help to explain this strong seasonal trend in gold; Indian wedding season, which begins in September, portfolio managers typically make fresh allocations the week after Labor Day, etc. While there are certainly numerous factors that impact this seasonal trend, the important thing is that it clearly exists and we shouldn’t overthink it.
A powerful statistic: Even in the recent gold bear market years, 2012-2014, gold has been higher during August of each year; The last time gold had a down August was 2009.
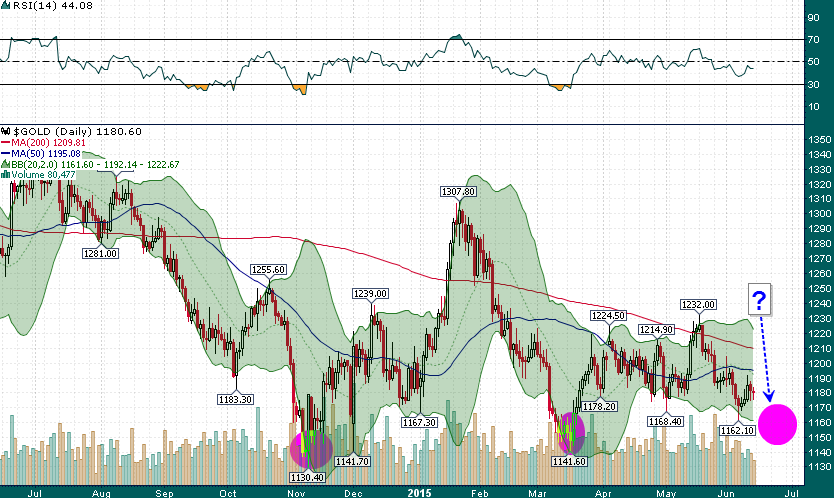
- A 3rd and final factor comes in the form of the technical structure of the gold chart:
The March low was a higher low from the November 2014 low and it occurred on lighter volume. The recent drift lower has taken place on relatively low volume, with very little downside momentum. A further dip over the coming weeks could see another higher low put in place, with a higher low in momentum (Daily RSI-14) and a lower low in volume - all bullish factors with all else remaining equal.
Original post
Gold – the final bubble, page-860
-
-
- There are more pages in this discussion • 3,828 more messages in this thread...


You’re viewing a single post only. To view the entire thread just sign in or Join Now (FREE)