Hi all
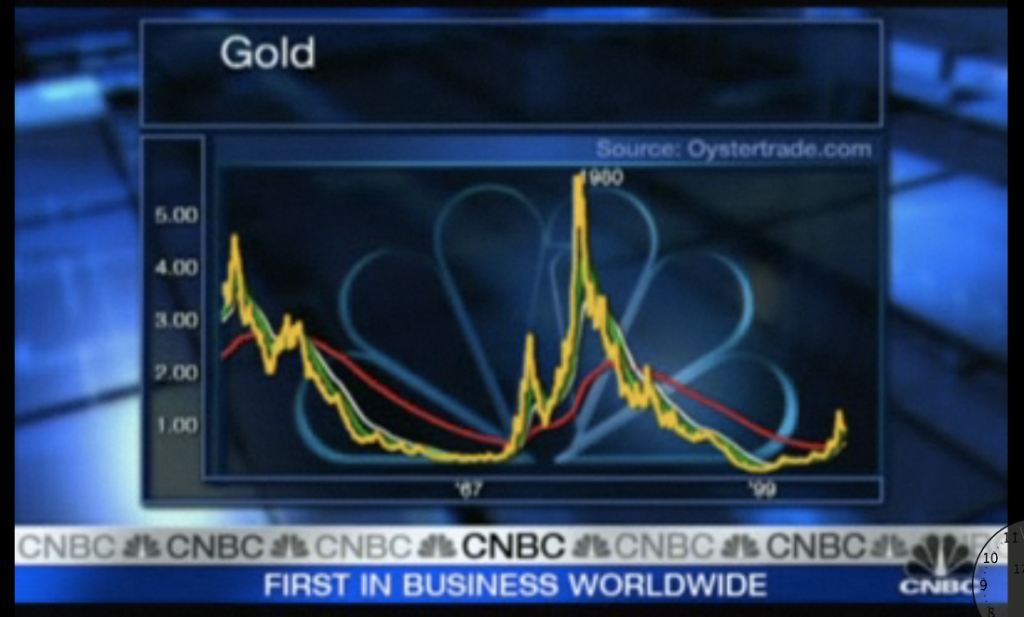
Thought you all might be interested in this chart which I did a print screen copy of a segment from CNBC. The link is below and should be still there.
The thrust of the segment was that the chart represents gold = the S&P x 5. The point of the chart is to note the similar patterns developing and the time frame.
Anyhow I hope the link still plays and is useful. It certanly makes sense to me.
http://www.cnbc.com/id/15840232?video=1257314063&play=1
Cheers
BW
- Forums
- ASX - By Stock
- GOLD
- gold $5000+ 11/11/09
gold $5000+ 11/11/09, page-10
-
- There are more pages in this discussion • 8 more messages in this thread...
You’re viewing a single post only. To view the entire thread just sign in or Join Now (FREE)


