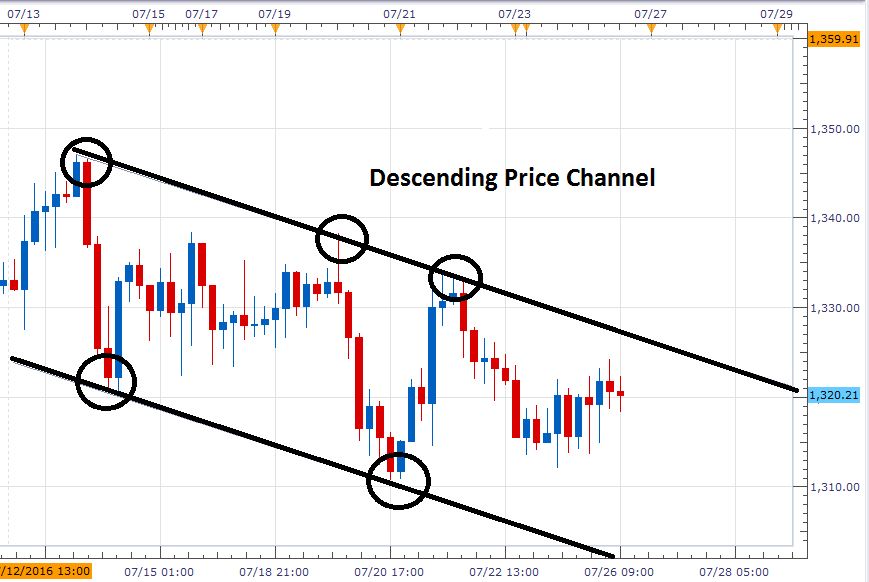
Gold Prices Channel Ahead of FOMC
GOLD, 4-Hour Chart
Charts and analysis from Walker England of DailyFX.com
"It should be noted that the first bearish historical distribution currently resides at $1,318.00. The Grid Sight Index found that prices declined $2.00 or more in just 23% of the matching 833 historical matching events. A move through this value would suggest new bearish momentum emerging for Gold prices. Ultimately, if prices continue to trade lower, traders may begin to focus on the channel low near $1,300.00."
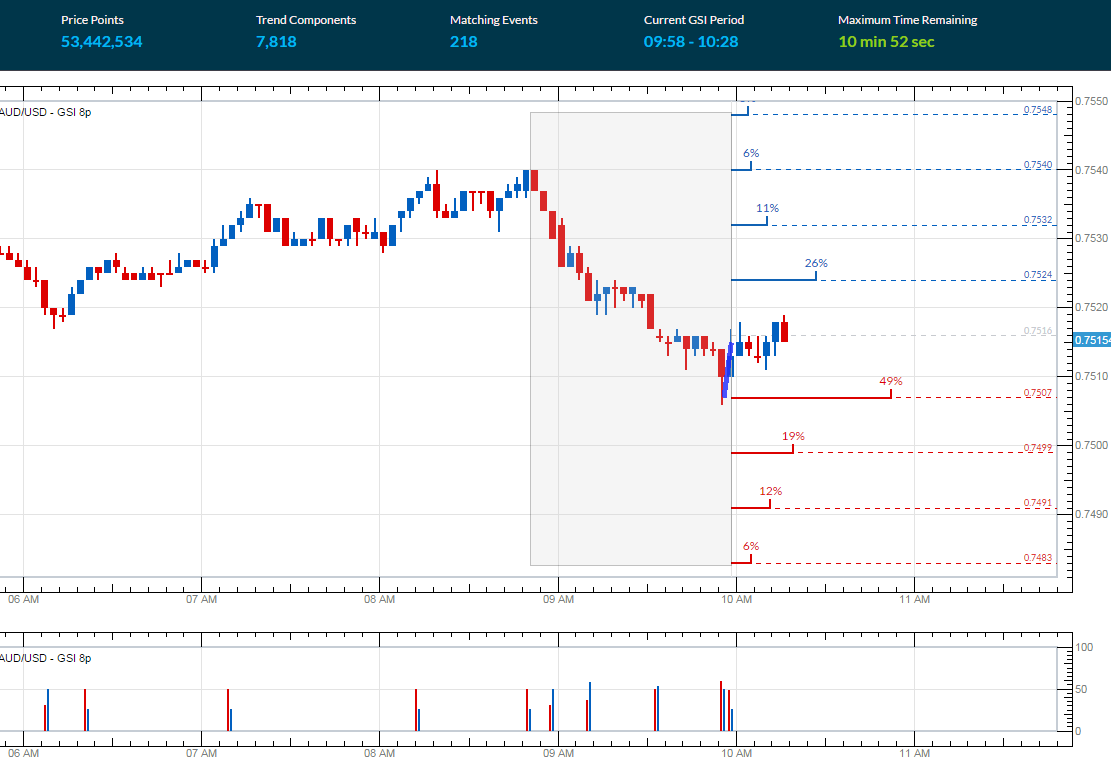
Gold 5 Minute GSI Chart
Past performance is not necessarily indicative of future results.
Gold Prices Channel Ahead of FOMC GOLD, 4-Hour Chart [img]...


Featured News
Featured News
The Watchlist
RC1
REDCASTLE RESOURCES LIMITED
Ron Miller, Non-Executive Director
Ron Miller
Non-Executive Director
Previous Video
Next Video
SPONSORED BY The Market Online