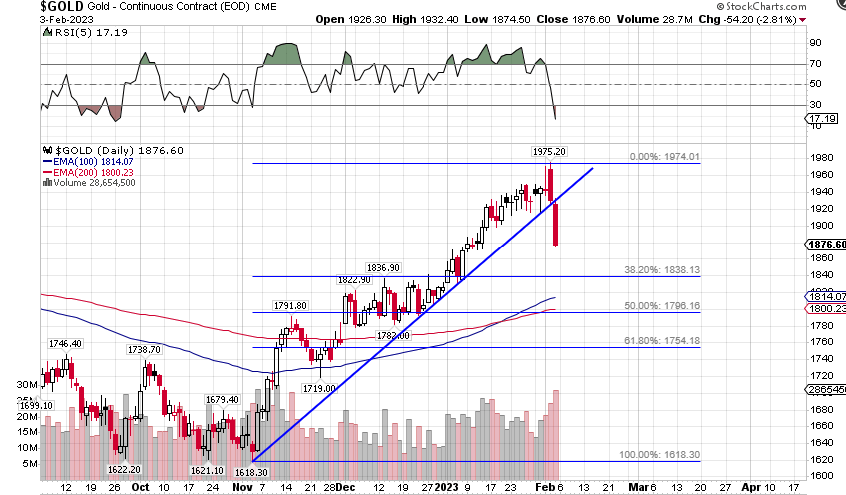
atalyzed by the FOMC meeting, thegold priceput in a definitive cycle high at $1,975 and then made a hard U-turn and broke below the upward sloping trendline shown inFigure 1. This confirms that the gold price is now in its declining phase for this daily cycle. I expect its retrace to the short and shallow. Why?
Figure 1
Based on the historical precedent, prior first daily cycles have always retracedat least30% of the prior advance. The first peak in the multimodal distribution inFigure 2is centered around the 35% retracement level plus/minus 5% which would correspond in this case to a range of$1,830 to $1,868. A retrace of 50% of the prior advance, would correspond to $1,800. This overlaps with part of the consolidation zone between ~$1,800 to $1,837shown inFigure 1.
Figure 2
Next there is the10yr yieldwhich, as expected, reacted opposite to the gold price and rose to 3.53% on the day (Friday, Feb 3). If thedescending triangle patterninFigure 3continues to play out, the 10yr yield could be expected to tag the top of the descending triangle pattern somewhere between 3.6% to 3.7%. With the 10yr yield currently at the top of a consolidation band, which is bounded on the top by the 100d EMA, once it breaks above it, the yield could quickly move to the 3.6% to 3.7% target. Thus, we could see the low within the next week or so. A potential catalyst for this could be the raising of the US debt ceiling. This would allow the US Treasury to increase debt issuance which consequently could put upward pressure on yields...
atalyzed by the FOMC meeting, the gold price put in a definitive...
-
- There are more pages in this discussion • 12,490 more messages in this thread...


You’re viewing a single post only. To view the entire thread just sign in or Join Now (FREE)
Featured News
LU7
Discover the strong preliminary feasibility of the Bécancour Lithium Refinery, showcasing resilience in a low pricing environment and a strategic plan to capitalize on future price recoveries