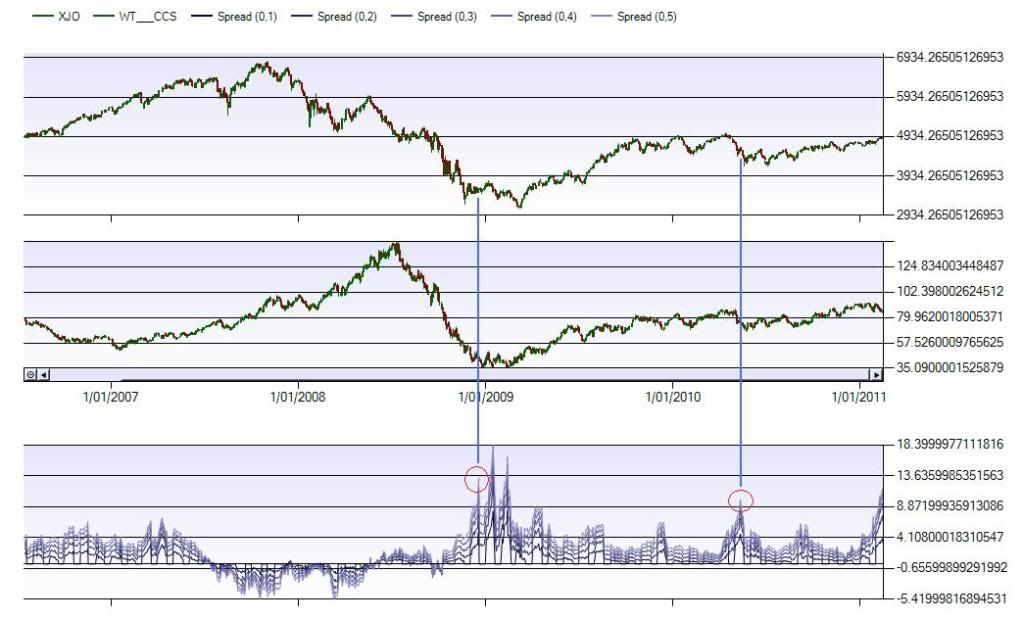
This chart is XJO and WTI Forward Spreads. I'm looking to enter longs on oil, XJO volatility looks to be contracting. Hourly oil chart looks good for buys below $85. If it breaks down, then daily suggests possible further low around $80.
I added 2 red circles at similar level on the spread peak, and they looked good time to buy crude oil in the following maybe 1-4 weeks. XJO seemed to have a slightly lower low, for a good XJO buy say 4-12 weeks forward.

- Forums
- ASX - By Stock
- XJO
- good lord its the running of the bulls
XJO
s&p/asx 200
Add to My Watchlist
0.08%
 !
8,603.0
good lord its the running of the bulls, page-4
Featured News
Add to My Watchlist
What is My Watchlist?
A personalised tool to help users track selected stocks. Delivering real-time notifications on price updates, announcements, and performance stats on each to help make informed investment decisions.
 (20min delay) (20min delay)
|
|||||
|
Last
8,603.0 |
Change
7.200(0.08%) |
Mkt cap ! n/a | |||
| Open | High | Low |
| 8,595.8 | 8,616.8 | 8,589.5 |
Featured News
| XJO (ASX) Chart |
The Watchlist
NUZ
NEURIZON THERAPEUTICS LIMITED
Dr Michael Thurn, CEO & MD
Dr Michael Thurn
CEO & MD
SPONSORED BY The Market Online


