A simple glance at "OC's" 5 year chart will show the SP is STILL on the rise
Bring your Shakespeare, bring in your poems, bring in your languages, bring in your medians, and not a single one will change the 5 year chart, OC's or the Official ASX one.
Good News & Bad News, page-43274


Add PLS (ASX) to my watchlist
 (20min delay) (20min delay)
|
|||||
|
Last
$2.95 |
Change
0.150(5.36%) |
Mkt cap ! $8.790B | |||
| Open | High | Low | Value | Volume |
| $2.81 | $2.95 | $2.81 | $30.60M | 10.66M |
Buyers (Bids)
| No. | Vol. | Price($) |
|---|---|---|
| 71 | 233633 | $2.94 |
Sellers (Offers)
| Price($) | Vol. | No. |
|---|---|---|
| $2.95 | 516085 | 128 |
View Market Depth
| Last trade - 14.34pm 07/08/2024 (20 minute delay) ? |
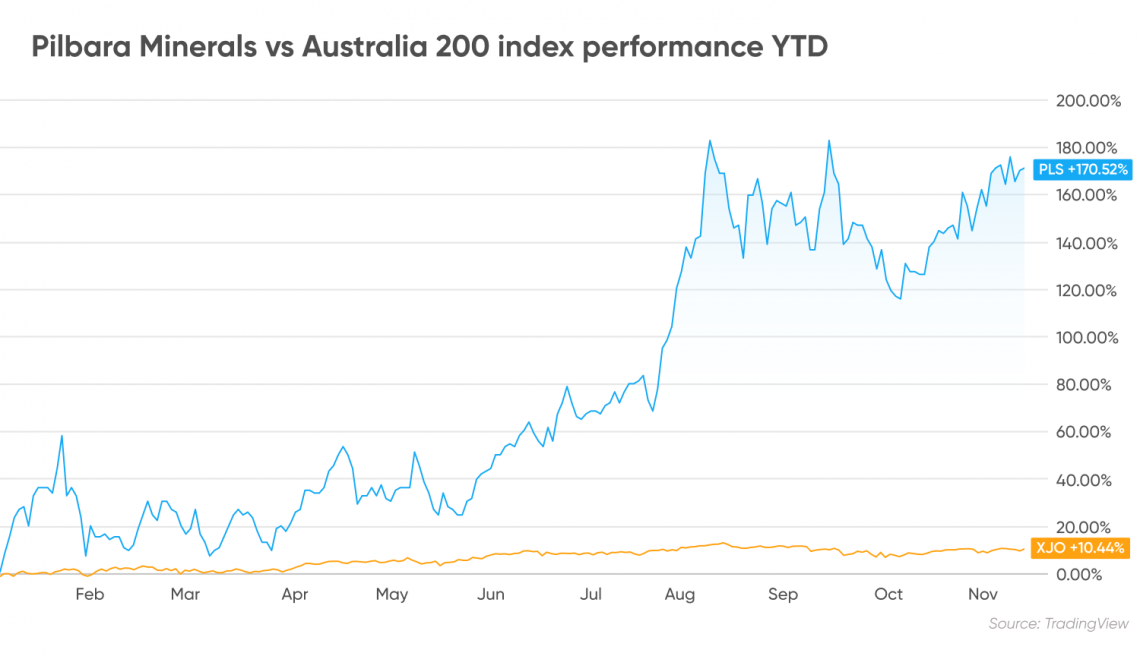
| PLS (ASX) Chart |