Hi bot
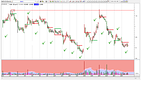
Something different to go with your thread title, here's an intraday chart, this being a simple 30min, the main point here is basically for the traders out there and also for anyone thinking about buying on a particular day that can see the intraday movement of the morning
The chart covers this month so far and I've marked off the high or low of the opening bar.
Notice that its a fairly good guide of what the rest of the days price is going to do, depending on if the high or low of the opening bar is broken.
If it breaks lower the price typically struggles all day, and if it breaks to the high side of the opening it normally is a good day, those are the days to take note of and obviously be buying in and also those are the days that Rorkes will be more successful with their pom pom waving :)
P.S. just a reminder also that the webinar 'BUY HOLD PROTECT' is on this Wednesday night 7pm, go to the CityIndex website for info
- Forums
- Charts
- gotta have faith monday
Hi botSomething different to go with your thread title, here's...
-
- There are more pages in this discussion • 7 more messages in this thread...
You’re viewing a single post only. To view the entire thread just sign in or Join Now (FREE)
Featured News
STX
Strike hands $48.5M contract to Clarke Energy to produce 20x 4.5MW gas engines for Sth Erregulla
MND
Albemarle lithium downsize burns $200M hole in Monadelphous's pocket as latter's contracts terminated
GML
Gateway Mining sells WA Eastern Montague gold project to Brightstar for $14M – half of that in shares
AVH
Avita boosts skin restoration product portfolio with 'dermal matrix' – a kind of next-level gauze made of fake skin
Add LYC (ASX) to my watchlist
 (20min delay) (20min delay)
|
|||||
|
Last
$6.11 |
Change
-0.180(2.86%) |
Mkt cap ! $5.711B | |||
| Open | High | Low | Value | Volume |
| $6.12 | $6.15 | $6.07 | $17.65M | 2.889M |
Buyers (Bids)
| No. | Vol. | Price($) |
|---|---|---|
| 5 | 26354 | $6.10 |
Sellers (Offers)
| Price($) | Vol. | No. |
|---|---|---|
| $6.15 | 3758 | 2 |
View Market Depth
| No. | Vol. | Price($) |
|---|---|---|
| 1 | 10596 | 6.100 |
| 2 | 329 | 6.090 |
| 3 | 1300 | 6.080 |
| 6 | 28264 | 6.070 |
| 2 | 166 | 6.060 |
| Price($) | Vol. | No. |
|---|---|---|
| 6.210 | 710 | 1 |
| 6.230 | 5000 | 1 |
| 6.280 | 4100 | 1 |
| 6.290 | 158 | 1 |
| 6.300 | 5200 | 1 |
| Last trade - 16.10pm 02/08/2024 (20 minute delay) ? |
Featured News
| LYC (ASX) Chart |


