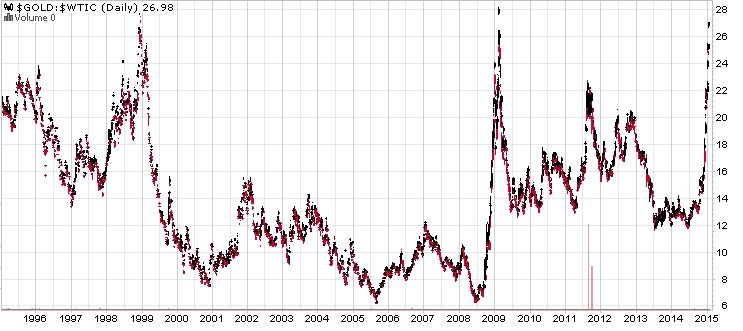
Will do a more complete chart later, as found an old ratio chart that stops 2010, unconventional format, takes while to update, has ratio hitting 35 in early 70s.
Quick chart without trend lines etc of last 20yrs, daily, due to error in OHLC mapping that becomes too large on weekly.
Cheers
Will do a more complete chart later, as found an old ratio chart...


Add XJO (ASX) to my watchlist
 (20min delay) (20min delay)
|
|||||
|
Last
7,988.1 |
Change
-25.300(0.32%) |
Mkt cap ! n/a | |||
| Open | High | Low |
| 8,013.4 | 8,013.4 | 7,918.9 |
| XJO (ASX) Chart |