Wise words Lekki!
This little party is not over yet imo.
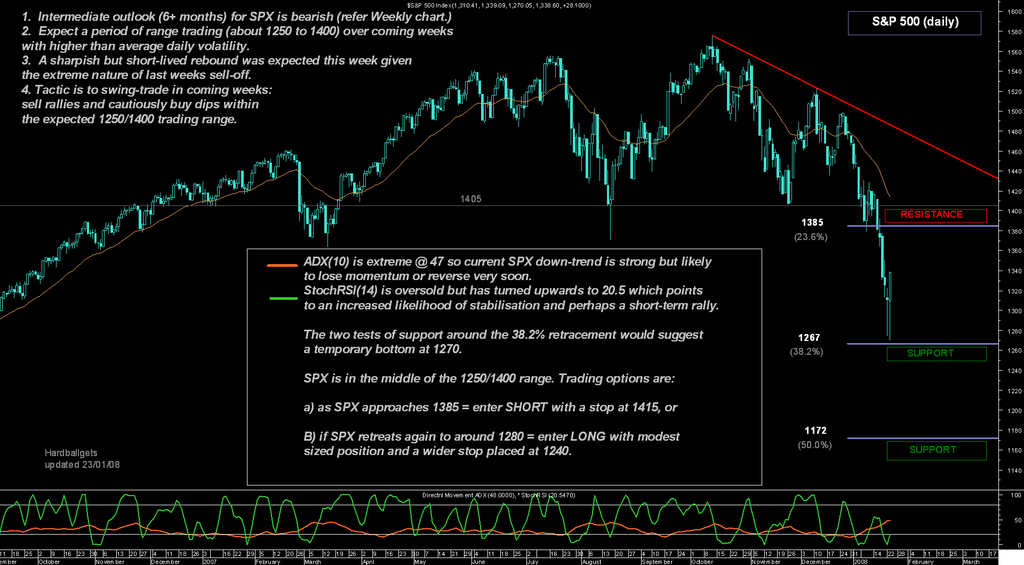
I notice that the XJO and S&P500 daily charts look very, very similar - perhaps the exceptions being the December 07 pullback was deeper for the S&P500, whereas the current retreat is slightly deeper for the XJO.
Trading strategy for both is pretty much the same I reckon - short rallies; respect the trend (bearish) and only go long above strong support and then with caution and very modest positions.
regards
- HBG
Trade the market you see - not the market you hope for!
has it lost steam, page-21


Add XJO (ASX) to my watchlist
 (20min delay) (20min delay)
|
|||||
|
Last
7,767.5 |
Change
7.900(0.10%) |
Mkt cap ! n/a | |||
| Open | High | Low |
| 7,759.6 | 7,819.0 | 7,754.9 |
| XJO (ASX) Chart |