S&P500 monthly and the MACD bearish cross caused by the 2011 sell off was a rare event and strong indicator of an extended bear market. Now it has crossed back above the signal line. What does this mean? Perhaps the 1998 MACD cross and recovery could give an answer. It preceded a year plus rally.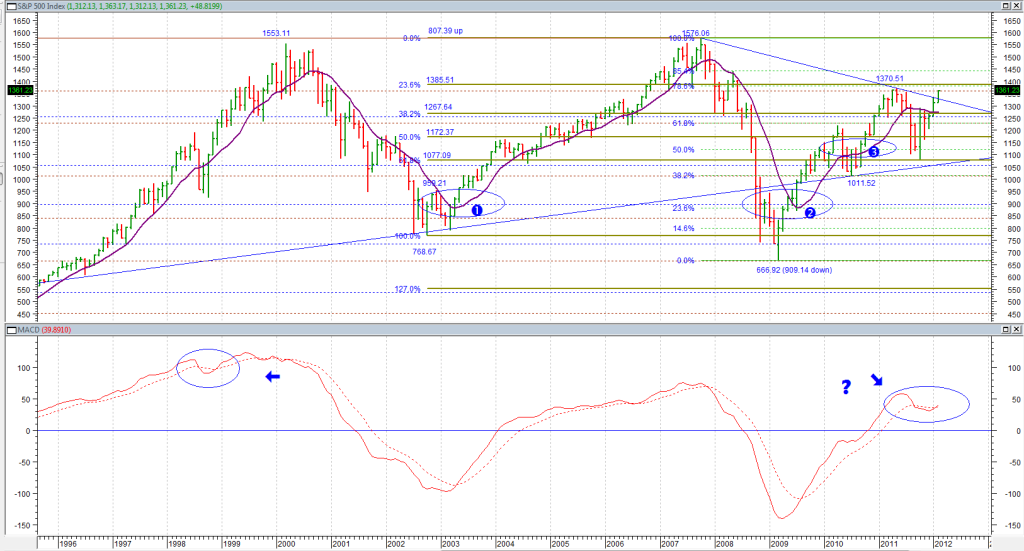
hctv presents life of investors monday, page-69


Add XJO (ASX) to my watchlist
 (20min delay) (20min delay)
|
|||||
|
Last
7,889.6 |
Change
72.800(0.93%) |
Mkt cap ! n/a | |||
| Open | High | Low |
| 7,816.8 | 7,902.6 | 7,816.8 |
| XJO (ASX) Chart |