Hi all,
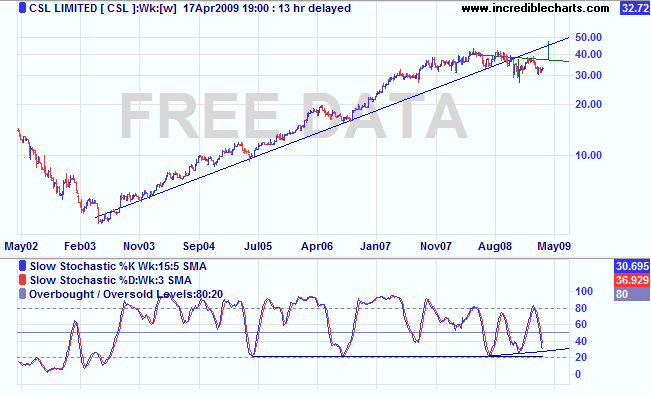
Having a bit of fun with the CSL chart, in particular the weekly chart for the last 7 years.
On this chart the blue line is the long term support line during the bull run CSL had from May 2003 until Nov 2008. For the initial few months of the bull run this line was resistance.
Back in Nov 2008 CSL broke below this line and has not currently re-tested it.
Currently CSL may be having all the planets align for a re-test of this line. On the weekly a possible reverse head and shoulder is forming (green line) dating back to June 2006.
The left shoulder was formed with the last test and bounce off the long term support line.
The head was formed by the break through this long term support line.
If CSL can continue in an upwards trend and complete the right shoulder then the target price would be around $48. Given the timeframe this would take to play out there is a good chance that this $48 would align very close with the long term uptrend line.

This would be the perfect play, left shoulder formed by bounce of long term support, head formed by break through long term support and completion hitting the long term support!
As previously mentioned in this thread I am a novice at this so my patterns may be completely wrong, but I will never know if I do not share it :)
- Forums
- ASX - By Stock
- CSL
- head of steam
head of steam, page-34
-
- There are more pages in this discussion • 116 more messages in this thread...
You’re viewing a single post only. To view the entire thread just sign in or Join Now (FREE)
Featured News
Add CSL (ASX) to my watchlist
 (20min delay) (20min delay)
|
|||||
|
Last
$311.12 |
Change
3.100(1.01%) |
Mkt cap ! $150.3B | |||
| Open | High | Low | Value | Volume |
| $308.75 | $311.12 | $306.32 | $220.9M | 712.8K |
Buyers (Bids)
| No. | Vol. | Price($) |
|---|---|---|
| 1 | 1100 | $310.80 |
Sellers (Offers)
| Price($) | Vol. | No. |
|---|---|---|
| $311.13 | 1131 | 2 |
View Market Depth
| No. | Vol. | Price($) |
|---|---|---|
| 1 | 1100 | 310.800 |
| 1 | 906 | 310.030 |
| 1 | 6 | 310.000 |
| 1 | 71 | 309.980 |
| 1 | 400 | 309.940 |
| Price($) | Vol. | No. |
|---|---|---|
| 311.150 | 50 | 1 |
| 311.170 | 100 | 1 |
| 311.190 | 103 | 3 |
| 311.200 | 150 | 1 |
| 311.210 | 250 | 1 |
| Last trade - 16.10pm 18/07/2024 (20 minute delay) ? |
Featured News
| CSL (ASX) Chart |


