Hi MEOmites
With the great news about Gurame today, I am a little behind the times, and I must visit that at another time.
In the mean time I have been looking at the Heron South 1(HS1) well. Whilst waiting for the production test to be completed I have been looking at the information we have so far. It has raised a few questions though.
First of all I have compared the HS1 information (TD 4454mRT) with the Heron-2(H2) (TD 4182) findings which were released in 2008.
* Jan 2008 General Meeting Presentation *
On P3 is the original graphic:
- Forums
- ASX - By Stock
- MEO
- heron - the story continues
heron - the story continues
-
to which I have added the present HS1 well details (from the HS1 reports) for comparison: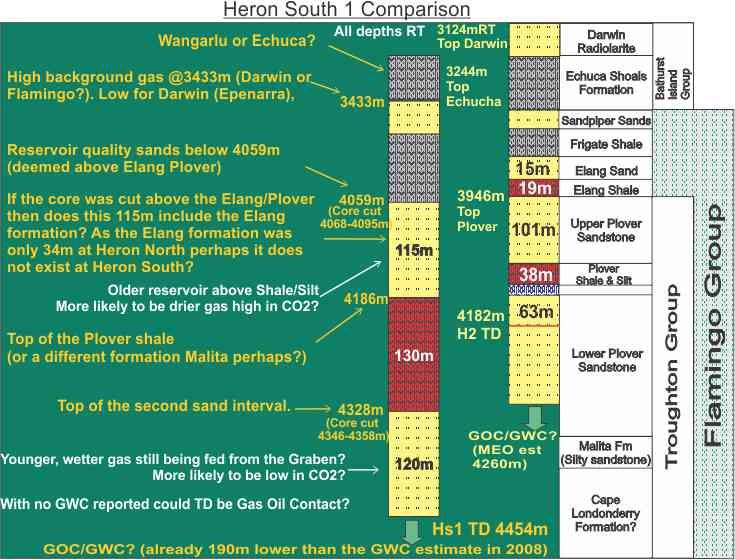
I have made a couple of notes on the diagram but here are a few more observations:- The high background gas @ 3433m is a mystery. It is 310m lower than the H2 top Darwin but 479m above the H2 top Elang.
If it is the Darwin/Epennara formation then the Bathurst Island Group must be a lot lower which means the Plover must be lower at Heron South.
If it is the Sandpiper Sands then the Flamingo group must be higher, which would mean the (Elang?)Plover Sands are higher.- The core cut from 4068 to 4095 is thought to be above the Elang/Plover formations which would confirm that the 3433m gas is Epennara and would make this sandstone formation the Sandpiper(Flamingo) but this is 100m below the H2 top Plover.
- The first 115m Sandstone appears to start from this point. If it is not Sandpiper then what happened to the Elang? The Elang was only 34m at Heron North so it may not have formed at Heron South. This would mean that the first 115m could be the Plover sands, but then the core must have been cut in the Plover.
- Alternatively, if the 115m pay is Sandpiper then the Flamingo Group must have dropped significantly in the HS fault, but is not obvious on the seismic.
- When HS1 reaches 4186m a 130m shale section starts. There are a couple of possibilities for this shale:
1. If the 1st sand was Sandpiper then it would logically follow that this is the Frigate formation
2. At H2 the Plover shale started at 4047m and was only 38m thick, but it could be thicker at HS1.
3. If we remember back to the first gas shows at 3433m it is difficult for me to correlate the differences between H2 and HS1 in both these areas which is why I am wondering if the shale/silt event could even be the Malita formation, which is next in line to the Plover on the stratigraphy:
* Which can be studied here *- From here we have another 120m sandstone where Eni declared Total Depth(TD), without declaring Gas Water Contact(GWC). This final section could be either the Elang (unlikely), Upper Plover, Lower Plover or Cape Londonderry?
- I think it is different to what was expected, but does any of it really matter, apart from my curiosity, as long it produces recoverable gas?
- As I have noted on the comparison diagram the upper 115m sandstone would have been filled earlier and the 130m shale/silt is most likely acting as a seal. Because of this it is most likely older drier gas, high in CO2. If it is still active and acting as a secondary source, as the lower 120m sandstone probably is, then it will be wetter and low in CO2.
- If this is the case then we would have a gas supply for both the TSLNG and the TSMP.
To help illustrate the structure I will use MEO’s Simplified Heron Structural Cross Section Figure 1 from the release:
* MEO opens the NTP68 Data Room - Oct 2010 *
Again, I have added the information from the HS1 well for comparison: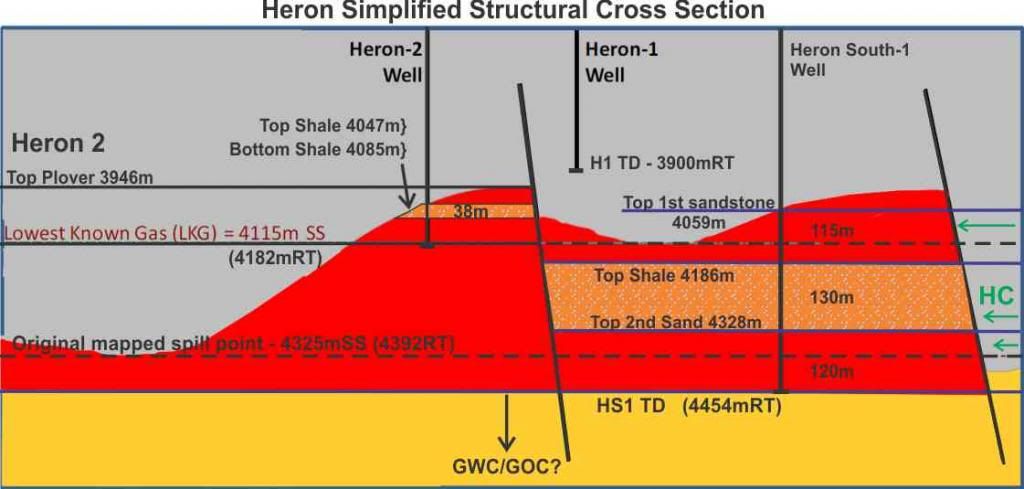
And also on the seismic cross section I have used before where we can see a depth comparison of the H2 and HS1 drilling programmes: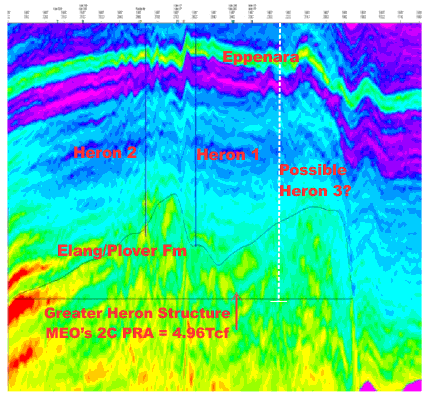
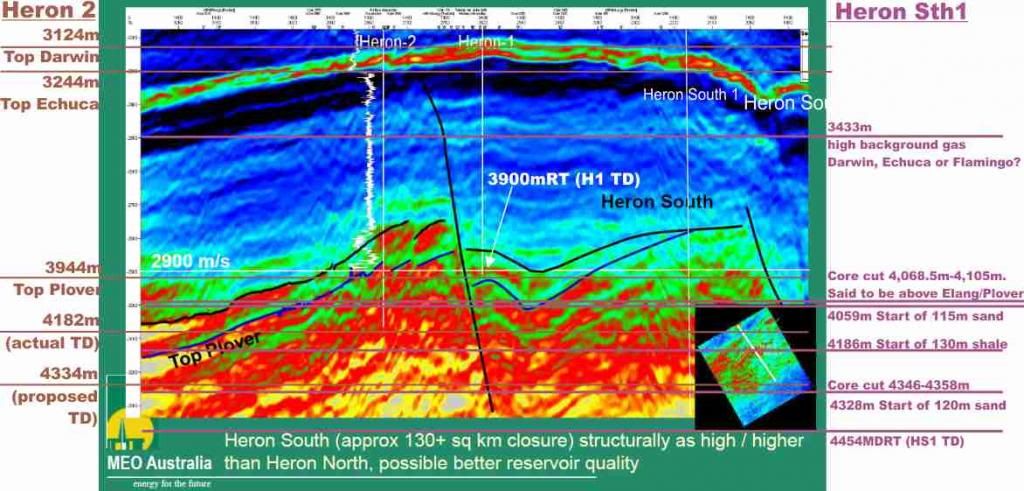
- Heron South is directly adjacent and above the Plover/Flamingo source rock which extends into ’The Malita Graben (which) is a north-east oriented trough that contains a thick Mesozoic to recent section exceeding 10km in thickness and is the main “source kitchen” for this petroleum system. This system feeds Troubador & Sunrise to the North East and is the start of the reservoir system that feeds Evans Shoal to the West and Blackwood to the north.
Source: * Jurassic Plover Petroleum Systems *
- Which brings me to the next point, touched on by Daz a while ago, and this is the Lowest Closing Contour(LCC)/Spill Point.
On P3 of the Oct 2010 Data room release above is the Heron Structure Map with reference to the LCC and Structural Spill Point: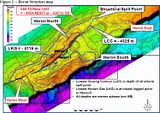
MEO used the contour of the LKG (which is also the Heron 2 TD) to show two distinct reservoirs at Heron North and South shown in purple.
From the later Schlumberger seismic interpretation MEO called the LCC at 4325m which joins North and South Heron to become Greater Heron. This is shown in blue.
Now the calculations become tricky because in the Data Room diagram the measurements are Sub Sea (SS). To get a comparative Measured Depth Rotary Table (MDRT) we have to go back to the 2008 Heron 2 drilling reports where the Lowest Known Gas is 4182mRT (which is also the H2 TD). The LKG on the structure map is 4115m.
The difference between the H2 TD 4182MDRT and the 4115SS LKG is 4182 – 4115 = 67m. So this puts the Atlas Rig RT (H2) 67m above the SS measurement.
From this I have deduced that we can add 67m to all H2 SS measurements to bring them to RT depth. This brings the H2 LKG back to -4182MDRT and the LCC estimate to 4325+67 = -4392MDRT.
Now we can go back to the Heron structure map and fill in the new LCC/Spill point/GWC which is 4325 + 62 = 4387. Each contour is 20m so the new LCC will be between the 4380 and 4400 contour which I have mapped out with a red line: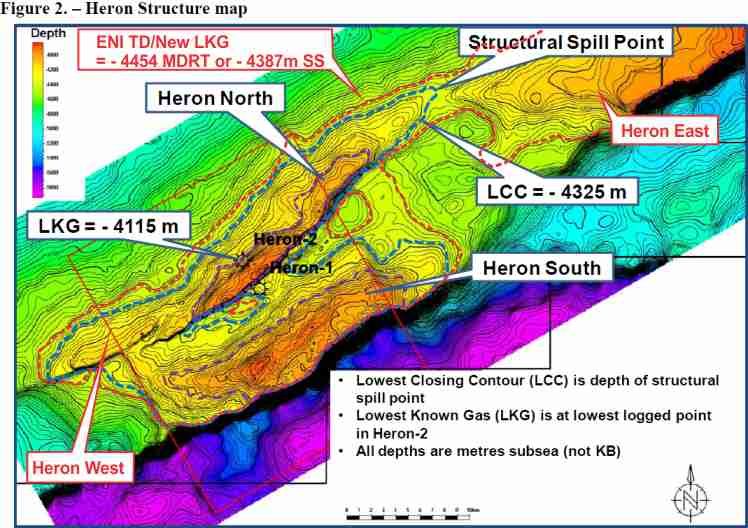
The new LKG contour in red shows that the Greater Heron Structure now includes Heron East. The GWC may even be lower and extend the structure even further!- Are the reservoirs inter-connected?
(* From the NT/P68 Farmout opportunity poster *
If we extend this 4390m contour through the neighbouring reservoirs of Evans Shoal and Blackwood we can see a vast system of reservoirs develop. I have shown this by adding an overlay to the NT/P68 Regional Trend graphic:
* P13 2008 Hong Kong presentation *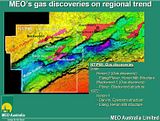
And with my additions: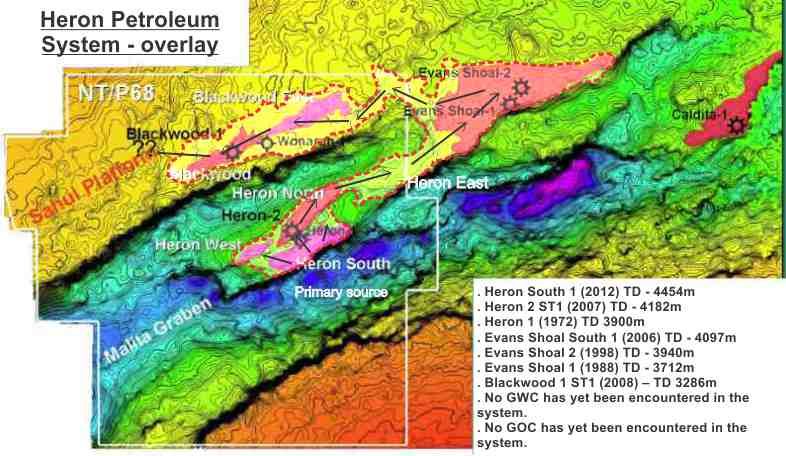
- There has been no GWC (or other liquids for that matter) in surrounding permits so it is a complex and deep reservoir system. Does this mean a Jansz/Io scenario with unitisation in the future, only time will tell.
The first thing for MEO to move forward is to prove up NT/P68, firstly with HS1.
Hydrocarbons must still be migrating which is why the H2 Plover gas samples were wetter and lower in CO2 being in the path of the primary migration of hydrocarbons which are fed from the source rock in the Malita Graben.
As the HCs move up through the Heron Terrace play (Heron, Evans Shoal, Blackwood, etc) it becomes older and drier and the CO2 content increases. All the reservoirs have their own, but similar, characteristics and are higher (updip) than the last:
Heron 2 ST1 (2007) – TD 4182mRT – Darwin gas (6 MMcf/d) and mud logs indicated wet gas in the Plover sands, low in CO2 but high temperatures and wellbore collapse prevented testing.
Heron 1 TD 3900mRT – Gas shows at Darwin and through the Flamingo formations but it did not penetrate the Plover sands because of positioning.
Evans Shoal South (2006) – 4097mRT – had minor gas shows but with well problems like H2.
Evans Shoal 2 (1998). TD – 3940mKB – 6.6Tcf @ 26% CO2. The well confirmed the presence of a 229 m gross gas column in Jurassic sandstones of the Plover Formation (>360 m thick) ……… with porosities ranging up to 15-20%, with net/gross ratios of 60-70%.....established a maximum stable flow rate of 25.5 MMscf/d at 2080 psi.
Evans Shoal 1 (1988). TD – 3712mKB – The most significant gas shows were recorded in low porosity sandstones of the Plover Formation and overlying Flaming Group ……. The presence of gas was confirmed on wireline logs, which indicated that at least a 167 m gross gas column was present.
Blackwood 1 ST1 (2008) – TD 3286mRT – est. 2.5Tcf gas (greater Blackwood) in the Plover Sandstones with 25% CO2.
A description of the Bonaparte exploration (which has already been posted by Daz and others) can be found here:
* Release Area NT09-1, Malita Graben *
The true value of the system is still to be unlocked but Eni will go a long way to solving the puzzle I am sure.
Hydrocarbons are present at HS1 and we are waiting eagerly for reservoir composition, flow rates and gas quality. If Heron is not commercial then it will be back to the drawing board but the information I have given here may give an indication what to look out for in the future.
It is only possible to do this as MEO choose to make so much information available, good or bad. Larger companies tend not to be so forthcoming but the MEO business model creates a transparent environment for their shareholders.
Traders like to play with the smoke and mirrors of some companies and MEO have had their fair share of manipulation in the past but for LT holders like me it is all about the fundamentals.
But this is only my opinion so please DYOR.
#:>))
My apologies for any bandwidth problems and slow links with this busy post, especially for you, Blurrt, on your mobile phone sipping lattes. - The high background gas @ 3433m is a mystery. It is 310m lower than the H2 top Darwin but 479m above the H2 top Elang.
- There are more pages in this discussion • 66 more messages in this thread...
You’re viewing a single post only. To view the entire thread just sign in or Join Now (FREE)
Featured News
Add MEO (ASX) to my watchlist
Currently unlisted public company.
The Watchlist
SER
STRATEGIC ENERGY RESOURCES LIMITED
David DeTata, Managing Director
David DeTata
Managing Director
SPONSORED BY The Market Online


