I can only take a light hearted view of this situation
I mean look at the chart....Oh Mr Hart.....
The idea is serious though
How to let trading profits run with some margin of safety,
There are several attempts at back testing SSN trailing stoplosses, some are to tight and are whipsawed out and in with not much more than brokerage loss others are riding the moving averages and the last is incorporating volatility into the price calculation...All are mechanical..
We have reached a plateau level and currently its trending down.Plenty of emotion and manipulation to rattle holders,
And strictly speaking the fundamentals are not supposed to influence stoploss placement..
on this chart I assumed we will hit 71 today on low volume
(a bot or two)
The previous Volatility stop was 66 and the present one is at 70 (pale and dark blue steps)
The three Exponential moving averages are 10/20/and 30 periods you can see how they back test
and a new experiment is with a fibonacci trading channel which divides the current retrace with fib levels..this basically means refining the midline channel pivot further
(Its a buy above 61 and sell below 38)
any other "TA" ideas help and critisisms would be great.
I am already aware its a long term hold for most
we are just looking at realistic opportunities for maximising trades
grr the chart above didnt print the stop data as it was supposed to in post preview
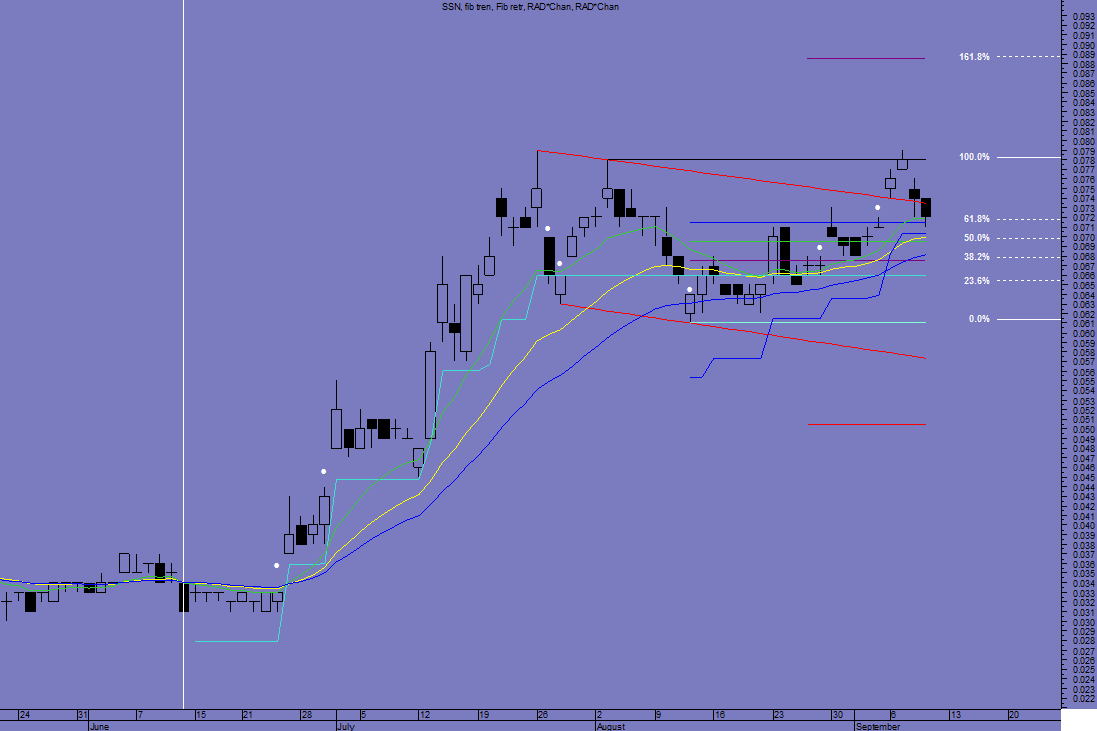
try this one, Its a bit wide but
the fib and Volatility based stop levels should be on the very top of the chart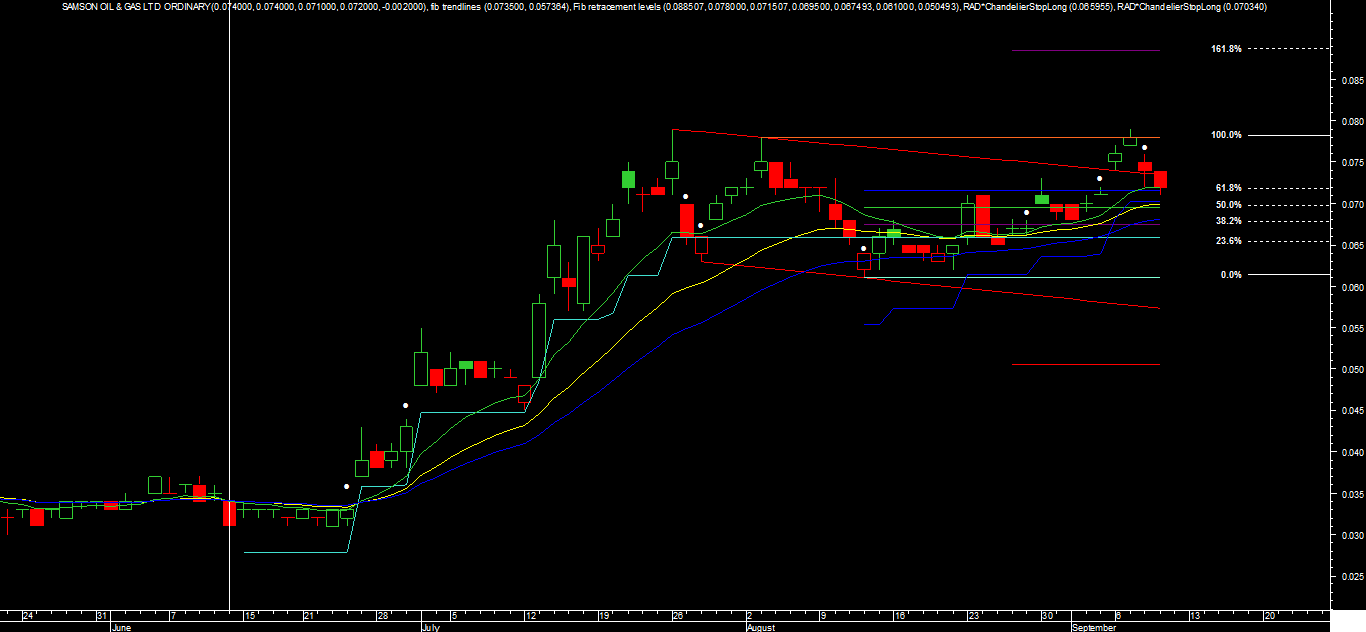
hi from the sandpit
-
- There are more pages in this discussion • 44 more messages in this thread...


This thread is closed.
You may not reply to this discussion at this time.
You’re viewing a single post only. To view the entire thread just sign in or Join Now (FREE)
Featured News
Add SSN (ASX) to my watchlist
Currently unlisted public company.
The Watchlist
MTL
MANTLE MINERALS LIMITED
Nick Poll, Executive Director
Nick Poll
Executive Director
SPONSORED BY The Market Online