The following seekingalpha website page is a view of UNG (The United States Natural Gas ETF).
My thoughts for PSA, this story is of a possible Henry Hub positive price increase. The HHub price has had 3 weeks of increases and sits above $3. This is a month away from the injection season finishing and the 98 bcf injected into storage is the biggest amount in months if not the whole injection season.
Keep in mind these points:
1. PSA's revenue is approx from 218 MMcfe per qtr: Mystic Bayou's 40 and Hummer's well 178.
2. PSA gets more revenue because of the oil/condensate at Hummer and so revenue =$0.875m per qtr
3. Right now the HHub price is going up (over $3) and as the article says $16 could be seen.
4. HHub price was as high as $13 in 2006 and $12 in 2008: see https://www.eia.gov/dnav/ng/hist/rngwhhdm.htm
5. Hummer's 2nd well awaiting completion
6. Henry Hub has main historic distribution of pipelines for natural gas
7. Shale gas producers dominate gas production but lack distribution to major population zones (e.g New York)
8. See "Global Blue Sun" on
= lack of sunspots that will see of Earth's cooling climate (Sporer minimum of 1450s) and another mini ice age
9. US winter of 2013-2014 as 27ᵗʰ Coolest in 124 years which saw over 3,000 Bcf pulled out of storage well
10. New NG uses: US power generation , Mexico pipelines multipying and LNG (Sabine Pass), all in last few years
11. NG storage has 8000 bcf base gas and 4000 bcf working gas. This working gas is being reduced as shale gas producers either lower injections through the non-winter months or have not got the production capacity to match consumer demand. The 98 bcf injected to Sep 28th is the first time in months of that size. Previous years have injections double that. Also because their access to pipelines is limited they seem to want a Just In Time market (need further research).
IMO (and I would believe Maki and Terry might as well), NG will be OK for PSA shs. Think HHub NG Futures at $10 and mainly shale gas producers such that the whole market is in turmoil. Our hopefully Hummer 2nd production well doubles our MMcfe and we get a good price.
https://seekingalpha.com/article/4210092-thing-holding-back-upward-explosion-natural-gas-prices
This Is The Only Thing Holding Back An Upward Explosion In Natural Gas Prices
Oct. 5, 2018 12:19 PM ET
About: The United States Natural Gas ETF, LP (UNG), Includes: BOIL, DCNG, DGAZ, GAZB, KOLD, UGAZ, UNL
HiddenValueInvestor
Long only, value
Summary
Natural gas in storage is on pace to be at historic lows entering the winter 2018-2019 season.
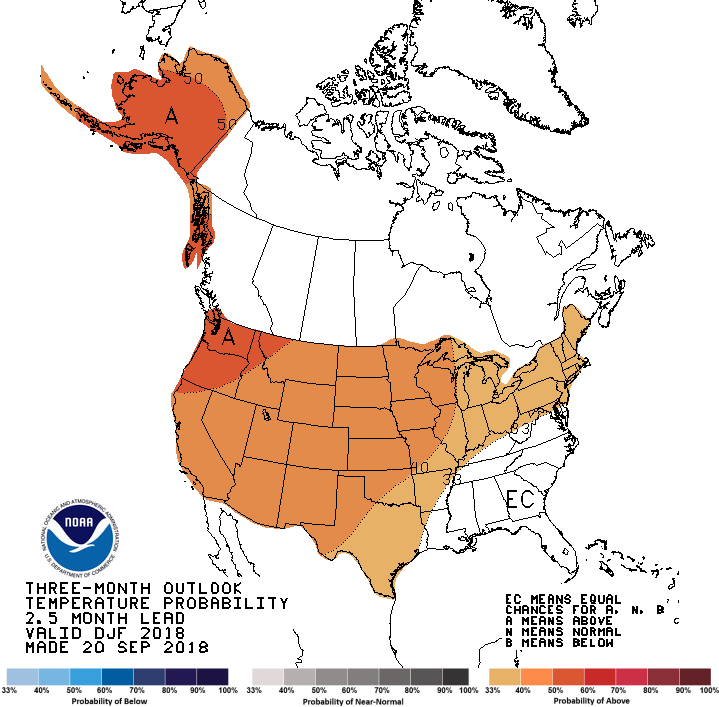
The current NOAA forecast is for a warmer-than-normal winter temperature pattern.
If the forecast changes, then natural gas prices could surge higher in anticipation of possible natural gas shortages at the end of the winter.
On May 29, 2018, I wrote the first in a series of articles on Seeking Alpha alerting investors to the significant problems the natural gas market could experience from a substantial shortfall in natural gas in storage before the start of the upcoming winter season. Since the end of May, the actual situation has only grown much worse. Now, the only thing preventing an upward explosion in natural gas prices is a warmer-than-normal winter. The NOAA is currently forecasting a warmer-than-normal winter. If the forecast changes to colder than normal, then investors can expect an upward surge in natural gas prices.
The average amount of natural gas in storage before the start of winter for the last couple of decades has averaged 3,800 billion cubic feet. Sometimes it has been a couple hundred billion cubic feet higher, and sometimes it has been a couple of hundred billion cubic feet lower. Keep in mind the natural gas market in 2018 is larger than it has ever been and much larger than it was a decade ago. This is partly due to growth in the population and partly due to the ongoing switch in power generation from coal to natural gas.
On May 29, when I first started writing on this issue, natural gas in storage was 499 Bcf below the five-year average. The most recent EIA report of natural gas in storage is as of September 28, 2018. The EIA report was released on October 4, 2018. It states:
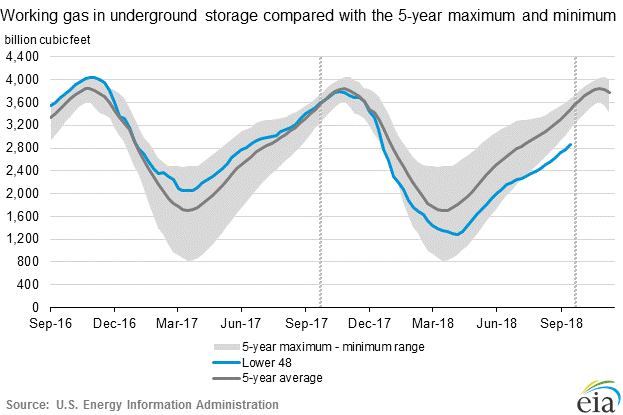
"Working gas in storage was 2,866 Bcf as of Friday, September 28, 2018, according to EIA estimates. This represents a net increase of 98 Bcf from the previous week. Stocks were 636 Bcf less than last year at this time and 607 Bcf below the five-year average of 3,473 Bcf. At 2,866 Bcf, total working gas is below the five-year historical range."
Here is the EIA graph of the five-year average of natural gas in storage:
The graph clearly shows that natural gas is well below the five-year minimum storage level. According the EIA report, over the last five years, the average amount added to storage between September 28 and November 9 has been 375 Bcf. Over the last five years, on average, natural gas began to be pulled out of storage by the week ending November 16. This is just the average, and this year could see more than 375 Bcf added to storage, or less. By adding 375 Bcf to the current storage level of 2,866 Bcf, investors can assume that natural gas in storage will only reach a range of between 3,200 Bcf and 3,300 Bcf before the start of the winter withdrawal season. The EIA report further states that the lowest amount of natural gas in storage before the start of the winter season since 2010 was 3,611 Bcf in November of 2014.
Finally, the winter of 2013-2014 saw over 3,000 Bcf pulled out of storage. Here is a look at how that winter ranks since the national temperature database was established 124 years ago.
The four-month 2013-2014 winter season from December to March was only the 27th coldest winter recorded for nationwide temperatures. On average, that winter was just less than 1 degree below normal. The 1978-1979 winter was the second coldest winter recorded and temperatures were 4 degrees below average during that winter. The amount of natural gas in storage right now is inadequate for any winter more than 1 degree below normal.
PERIOD VALUE 1901-2000MEAN AMOMALY RANK(1895-2018) 1 March 2014 1-Month 40.51°F (4.73°C) 41.50°F (5.28°C) -0.99°F (-0.55°C) 43ʳᵈ Coolest 2 82ⁿᵈ Warmest 3 Feb-Mar 2014 2-Month 36.32°F (2.40°C) 37.66°F (3.14°C) -1.34°F (-0.74°C) 35ᵗʰ Coolest 4 90ᵗʰ Warmest 5 Jan-Mar 2014 3-Month 34.40°F (1.33°C) 35.15°F (1.75°C) -0.75°F (-0.42°C) 41ˢᵗ Coolest 6 84ᵗʰ Warmest 7 Ties: 1920 8 Dec 2013-Mar 2014 4-Month 33.56°F (0.87°C) 34.54°F (1.41°C) -0.98°F (-0.54°C) 27ᵗʰ Coolest 9 Ties: 1922 10
The ONLY THING preventing a substantial upward surge in natural gas prices is the most recent NOAA prediction for the winter season seen below:

What investors need to understand is that the above forecast for warmer-than-normal winter temperatures is the current estimate. The pattern could change between now and December, and therefore this forecast can also change as we get closer to December. The estimate could get even warmer, or it could get colder. If the winter is warmer than normal, then there is enough natural gas in storage to get through the winter without shortages. That is what natural gas bears are hanging their hat on right now. But if the forecast flips to colder than normal, and that verifies, then parts of the country will not have enough natural gas to meet demand in the last part of the winter.
Seeking Alpha recently reported that Citi analyst Anthony Yuen estimates Henry Hub spot natural gas prices could rise to $12 to $16 per Mcf if the winter is much colder than normal. Current natural gas futures prices are $3 per Mcf.
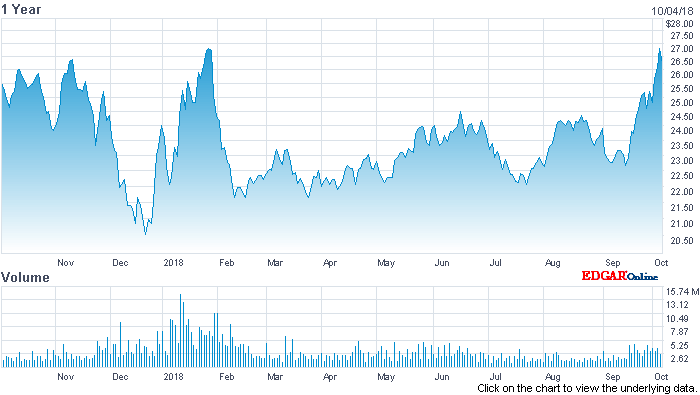
The United States Natural Gas Fund ETF LP (UNG) reflects the price movement in near-term natural gas futures traded on the NYMEX. The fund rolls front-month natural gas futures to the next month each and every month. It gives most investors the easiest way to purchase a stake in natural gas futures for a potential upward move in natural gas prices. The fund usually loses a little money each month as it rolls its futures to the next month. Therefore, it has not been a good long-term investment and should only be considered for a short-term trade of a few months, or even a few weeks. Below is the one-year chart for UNG:
Most investors consider the supply of natural gas to be growing and adequate. The chance for a spike in natural gas prices is overwhelmingly based on the possibility of a colder-than-normal winter. The winter could end up being warmer than normal, as currently predicted. But if the forecast changes to colder than normal, then investors should be ready to move on a potential surge in natural gas prices. Everyone should do their own due-diligence before investing in the United States Natural Gas Fund, or any other related natural gas investment.
Disclosure:I/we have no positions in any stocks mentioned, and no plans to initiate any positions within the next 72 hours.
I wrote this article myself, and it expresses my own opinions. I am not receiving compensation for it (other than from Seeking Alpha). I have no business relationship with any company whose stock is mentioned in this article.
The following seekingalpha website page is a view of UNG (The...
-
- There are more pages in this discussion • 9 more messages in this thread...


You’re viewing a single post only. To view the entire thread just sign in or Join Now (FREE)