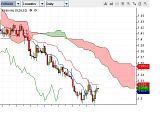
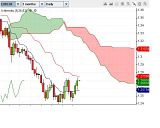
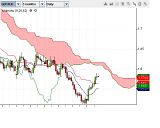
There was some talk about ichimoku recently, so thought I would share some interesting ichi charts and VERY brief note about them.
Suffice it to say that ichimoku looks extremely complicated but the more you use and learn about it, the more useful it becomes.
All are daily charts.
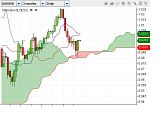
AUDUSD
Thinning cloud signalled the new year as a turning point (i never expected so far down though). A textbook bounce off the cloud suggests massive support to go higher. Chikou span might find support from previous price action and we may see a new all-time high if the next 2 weeks stays around current price.
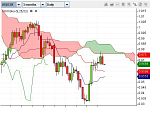
USDCHF
Resistance at cloud suggests not much upside here.
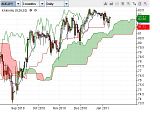
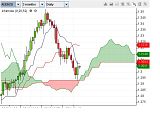
AUDJPY
wide view:
And zoomed in a bit:
Up up and away??? Bullish candles, back above tenkan, cloud continues to move up and get thicker....
AUDNZD
A nice touch on the cloud, and if the other AUD charts are anything to go by, could see some upside also. But tenkan coming down quick, kijun will also fall. Cloud thin at present and might slice right through. If price falls below the cloud, then future cloud bottom (1.3080) might be solid resistance for a while.
EURAUD
These are the ones I have trouble with. Looking good for a bounce up but need to wait perhaps until kijun (1.3250) convincingly broken.
EURCHF
Very similar to EURAUD.
GBPAUD
A really interesting one that a screenshot can't do justice to.
Previous action would suggest the cloud is strong resistance and we will see the trend continue - but cloud thinner now than at any point for a while.
XAUUSD
Never looked at gold before using ichimoku. Up we go in the short term. 6 month long trend supported by the cloud beautifully, but cloud flattening out.
There you go. I'm still learning about ichi so please don't base anything upon this!! Hope this is useful for some.
:)
- Forums
- Forex
- ichimoku charts
