
$MAH daily chart just keeps getting stronger now with green candles forming on the rising 20sma which is well above the 200sma. Since the first leg up went from 20 to 25 cents it is anticipated that the second leg up would move the share price from 23 cents to 28 cents for the new target. Also see this:

$MAH daily chart just keeps getting stronger now with green...

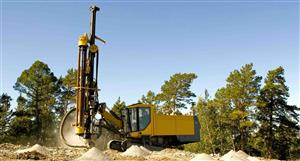


Add MAH (ASX) to my watchlist
 (20min delay) (20min delay)
|
|||||
|
Last
32.0¢ |
Change
0.005(1.59%) |
Mkt cap ! $678.8M | |||
| Open | High | Low | Value | Volume |
| 31.5¢ | 32.3¢ | 31.5¢ | $247.3K | 775.2K |
Buyers (Bids)
| No. | Vol. | Price($) |
|---|---|---|
| 28 | 210318 | 31.5¢ |
Sellers (Offers)
| Price($) | Vol. | No. |
|---|---|---|
| 32.0¢ | 48436 | 5 |
View Market Depth
| Last trade - 10.39am 03/10/2024 (20 minute delay) ? |
| MAH (ASX) Chart |