
The Old Geezer might be right, but inflation does seem to have peaked back in December, 2022. It still has a way to fall before being normalised, but it does seem to be falling. Just maybe, the RBA won't be too far off ending rate hikes.
XJO Daily Chart.
XJO down a modest -0.32% this week.
The trend remains down. Last Monday, XJO hit the top of the Standard Error Channel. On Tuesday, the ASX was mugged by the RBA rate increase, and the XJO remains solidly within the down-trend. It is now sitting at the 200-Day Moving Average where it has bounced before. Until we see a significant break of structure by setting up a higher high and higher low, we have to presume the down-trend remains in place. We need to see a close above Monday's high and above the 50-Day
MA to feel that a new uptrend is in place.
The chart finished Friday at the centre of the down-trend channel and RSI is sliding sideways, so there is a chance for our market heading upwards.
American SP500.
The American SP500 consolidated for four days last week, then on Friday attempted a break above major resistance. Intra-day selling forced the index back under the resistance level. Coming at the top of a long trend, that may indicate the start of a pull-back.Plenty of support lies near-by and a significant "Point of Control"exists at about 4135 - SP500 finished at 4300 (round numbers) on Friday."Point of Control" shows as a long darkish rectangle on the Chart. You can see how many candles are arrayed along that "Point of Control". That's where the biggest battles between bulls and bears have been fought. Having won that battle - the Index headed higher and is likely to find strong support at the level if the SPX does pull back.Note that the Australian market has disconnected from the American market - so action in America is not a good guide to what will happen in Australia.XJO Weekly Chart - Something to keep in mind.
In the first half of 2022, XJO formed a Head-and-Shoulders formation which reached its culmination in just one week in the middle of June.Now, XJO may be forming another H-n-S formation. It began forming back in November 2022 and hasn't yet completed. If it does complete, then we could be looking at another test to the 6400 level (round numbers). XJO is now at 7120 (round numbers).There are no guarantees that it will complete - but keep this in mind. A break down through 6900 (round numbers) could see a quick capitulation.Sector Performance this past week.
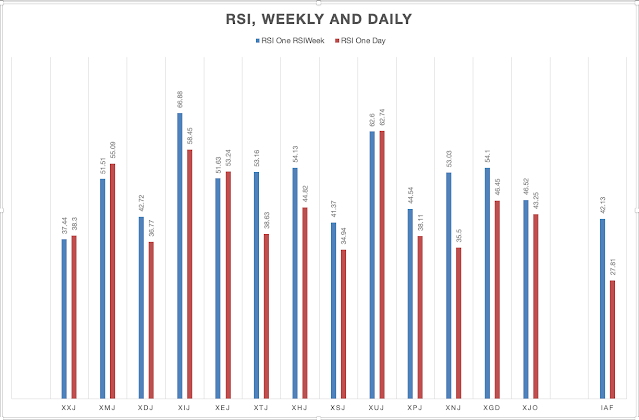
XJO was down a little this week -0.32%,but, only three sectors were up: Materials (XMJ) +2.05%. Utilities (XUJ) +1.13%, and Energy (XEJ) +0.44%.The worst performer this week was Information Technology (XIJ) down -2.95%. XIJ has been an outstanding performer for a long time - but is now taking a rest. Look to buy the dip:The banks continue to weigh on the XXJ. Three of the big banks fell heavily this week. CBA down this week -1.15%, NAB -2.29% and Westpac -1.41%, But ANZ was the odd man out, up +0.35%.Momentum.A quick way to judge momentum is to compare the Weekly RSI and the Daily RSI.By this method, XMJ, XEJ and XXJ have positive momentum. XXJ might have positive "momentum" by this metic - that doesn't mean that it's chart is going to the upside - but that the Rate of Change has slowed perceptibly - so it might be about to go to the upside.Conclusion.
The Australian market has been in a down-trend since mid-April. That's in stark contrast to the American market, buoyed by rampaging tech stocks, which has been in an up-trend since mid-March.
Stay cautious until we can see a definite change in the trend from down to up.
The Australian market is closed on Monday for the King's Birthday holiday held in most of the Australian states (except Queensland an WA.)
The Old Geezer might be right, but inflation does seem to have...


Add XJO (ASX) to my watchlist
 (20min delay) (20min delay)
|
|||||
|
Last
7,948.8 |
Change
-154.400(1.91%) |
Mkt cap ! n/a | |||
| Open | High | Low |
| 8,103.2 | 8,103.2 | 7,939.4 |
| XJO (ASX) Chart |