
Sunday, 14 May, Weekly Report. Australian Market.
This week has been a slow week on the Australian Market with almost no movement in the XJO from Wednesday to Friday. XJO was up +0.51% for the week - most of that occurring on Monday and Tuesday.
Weekly Performance of Sectors (plus Gold Miners, XJO and Bonds)Seven sectors up. The two best were - Information Technology (XIJ) +1.97% and Health (XHJ) +1.45%.
Four sectors were down - three of which were Defensives. Utilities (XUJ -1.13% and Staples (XSJ) -0.47%. Energy (XEJ) was only down marginally -0.08%.
The following data is a medium term measure of momentum obtained by subtracting Weekly RSI from Daily RSI.
MomentumThe only sectors with positive upside momentum are Property (XPJ), Energy (XEJ), Health (XHJ) and Information Technology (XIJ). A sector with negative momentum has serious doubts about its future performance. The worst three sectors for momentum were Utilities (XUJ), Staples (XSJ) and Discretionary (XDJ). You'll notice that two of those sectors (XUJ) and (XSJ) had negative performance on the Weekly Sector Performance scale. XDJ was the worst performer (relatively) of the seven sectors which were positive this week.
Included on the Momentum Chart, besides sectors, were Bitcoin and Gold Miners. These are volatile instruments which require trading rather than buy-and-hold. They have performed well over the past year (see below on the Mansfield RS Weekly Chart) but they have gut-wrenching rises and falls - too much for most traders/investors to stomach.
XJO DAILY CHART.
XJO is in a sideways consolidation movement - bracketed by two Supertrend Lines. one above and one below.
Friday was a narrow range day and finished more or less on the 50% mark between the high of 1 May and the low of 4 May. It is also hugging the 8-Day EMA which is a short-term dividing line between bullish and bearish.
RSI and Stochastic are both more or less at mid-range - around 50. RSI at 49.82 and stochastic at 48.66.
On the plus side, XJO is above the 50-Day MA and the 200-Day MA.
Watch for one or other of the two Sup[ertrend lines to turn bullish or bearish. Yellow = bullish, blue = bearish.
STW Daily Chart with Volume.
STW is a tracking ETF for XJO so the chart has a close resemblance to the chart of the XJO.
This chart has a couple of Volume features added to it. The size of each candle is determined by the volume traded on that day.
On the Y Axis (left-hand side of the chart) is a Volume Profile. This shows the volume traded at each level of the chart over the past 50 days.
I've noted on the chart the Point of Control. That's the level at which most shares have been traded over the past 50 Days. It marks the level where bulls and bears battle for control of the market.
The Point of Control coincides with Friday's candle. The next few days should decide who prevails - bulls or bears.
SP500 Daily Chart.
SP500 is also in a sideways consolidation - bracketed by two Supertrend, one bullish (yellow) and one bearish (blue) and parallel to each other. These Supertrend Lines are set higher on the SP500 daily chart than the XJO chart.The Point of Control is also set much higher on the SP500 chart than on the XJO chart. A move higher here on good volume could see the SP500 shoot much higher above overhead resistance and take the XJO up with it.Performance of Sectors plus Gold, Bitcoin and Bonds over one year and over 52 Days.
Mansfield Relative Strength allows a viewer to see how a stock or sector has performed against a pre-set marker. In this case, I've used the pre-set marker at the XJO. In this way you can see how well or poorly a stock or sector is performing in the medium term and the long term.
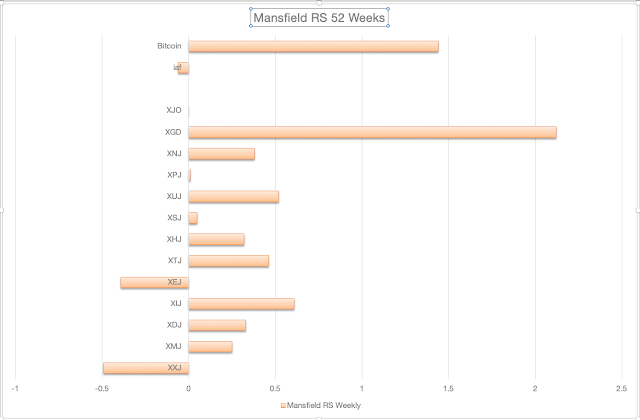
Long Term Performance - One Year.
Ou-performing the XJO have been Gold Miners and Bitcoin. Before you decide to jump into those two you must look at the chart below - showing medium term performance.The two best performing sectors are XIJ and XUJ. Academic studies have shown that sectors performing the best over the past year tend to out-perform over the next year, i.e., look for out-performing stocks in those sectors over the coming year.Medium Term Performance - 52 Days.
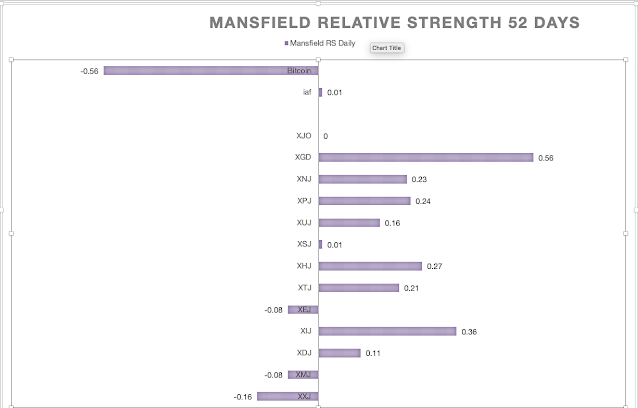
Above shows the performance of Sectors plus Gold Miners, Bitcoin and Bonds (IAF) over the past 52 Days.(Remember, Past performance does not guarantee future performance, saith the Market Guru.)Here we can see, over the past 52 Days, the worst performer was Bitcoin - by a long way. Bitcoin can be very volatile - good for competent traders - but gut wrenching for Newbies.Gold over the past 52 Days has maintained its dominant position, but note, above, XGD has done poorly in the past week, down -5.34%. So - be prepared for a roller-coaster ride if you are interested in Gold. Again - great for competent traders - not so for Newbies.Meanwhile, Financials (XXJ) continues to underperform the XJO over the past 52 Days. Until things improve for the four big banks, they are best avoided.Stocks/Bonda Ratio.
The Stocks/Bonds Ratio peaked recently on 19 April. Since then it has been in decline and the 5-Day MA is now below the 20-Day MA. X-Overs of the 5-Day and 20-Day have had a good record for predicting further downside in the market. Until a positive cross-over occurs it might be wise to stay defensive.
Conclusion.
XJO is stuck in limbo land at the moment. Volume Profile suggests it is at a key level for the market. A move to the upside could see much more upside, and vice versa.
For those who are competent, confident traders, money can be made trading Bitcoin and Gold Miners. Newbies - stay away.
The big four banks in Australia have been a drag on our market. They are probably best avoided.
I'd still be looking for stocks in Information Technology is interest rates to hold steady or start to fall.
Stay safe.
Indices 08/05, page-167


Add XJO (ASX) to my watchlist
 (20min delay) (20min delay)
|
|||||
|
Last
8,346.7 |
Change
63.500(0.77%) |
Mkt cap ! n/a | |||
| Open | High | Low |
| 8,283.8 | 8,349.7 | 8,283.8 |
| XJO (ASX) Chart |