
Weekly Wrap, Week ended 14 October, 2022. Is the Bear finished?
XJO Monthly Chart.
This chart is almost identical to the one shown last week. XJO made a good start to the month, but this is only Week One of October. Week Two has been flat. The chart remains in a down trend.XJO Weekly Chart.
This week's candle is a "dragonfly doji" - which means the XJO finished almost where it started after having a big dip down during the week. XJO finished down just -0.06%, essentially flat.
This week's candle remains marginally above the 8-Week EMA. One of the two Supertrend lines has switched from blue (bearish) to yellow (bullish). That suggests the XJO is in non-trending mode. Hull MA13 remains headed down. This chart is more bearish than bullish. has run into the resistance of the other Supertrend lines.
XJO has, however, bounced off horizontal support - so it may be headed higher to again test the 50-Week MA as resistance.
XJO Daily Chart.
XJO was down strongly on Monday, waffled around on Tue-Thur, then surged higher on Friday.
The Index remains within the confines of the descending broadening wedge shown on the chart. A break to the upside of that wedge would be bullish, but then it faces the resistance of the 200-Day MA. As a general rule, it is best not to enter long-term positions while the chart is below the 200-Day MA.
This week saw the XJO test the 50% retracement of the previous rally, and then bounced. That could be the start of another test of the oblique restraining line of the descending wedge. A break above that should see the continuation of the counter trend rally
Action on Friday raises the possibility that Tue-Thur is a higher low. We need to see a higher high to call this a bull rally, i.e., XJO must rise above 4 October.
SP500 Daily.
This is a fascinating study in chart analysis. From the high in August, the chart has made lower highs and lower lows - the definition of a down trend. The lower highs have all occurred after counter-trend rallies up to the descending 20-Day MA. Each time, the chart has declined to form a lower low.Momentum is slowing as shown by the MACD Histogram. It shows a positive divergence from the chart. This suggests the possibility of a trend change.
Thursday saw one of the biggest reversal days on the SP500 for the past 50 years. That produced a lot of euphoria - to be dampened by a big down day on Friday. Volatility like this often occurs at the end of trends as the bulls/bears battle for supremacy.
It will mean down day on the XJO on Monday.
ASX Sector Results for this week.
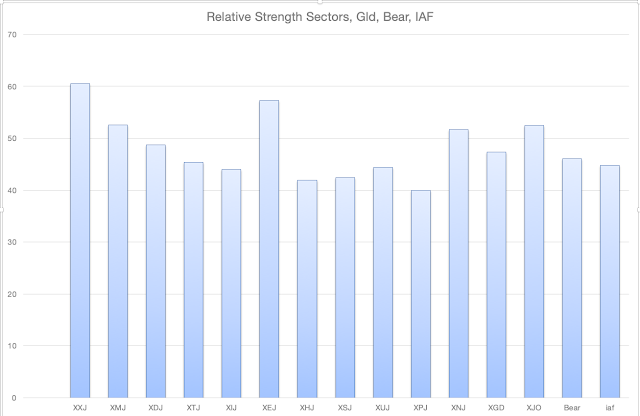
Three out of eleven sectors were up this week, two of those (Consumer Staples and Consumer Discretionary) were only up marginally. XJO finished flat for the week, but it was largely the good performance of Financials (XXJ) which kept the XJO more or less on an even keel. XXJ up +3.61%.Relative Strength of Sectors.
RSI (Relative Strength Index) is calculated using the default setting of 14 days - almost three weeks of trading. It provides a more reliable guide to changes in sectors than the one-week results which can jerk around quite a lot and, thus, RSI is probably a more reliable guide to recent strength in the sectors. (Click here for a description of RSI.)
Four sectors out of eleven are above 50: Financials (XXJ), Materials (XMJ), Energy (XEJ) and Industrials (XNJ). That's the same as the previous week. Leadership has now shifted from Energy to Financials. Energy and Materials were weak this week, but a return to the upside should lead to an improvement in the XJO as a whole.
NewHighs-NewLows Cumulative.
This is a metric for the long-term investor. While NH-NL Cumulative remains below its 10-Day Moving Average, it is best for long term investors to remain cautious and defensive regarding the market.
% of Stocks above key moving averages.1. % of stocks above 10-Day Moving Average: Last Week 76%, This Week 54%.2. % of stocks above 50-Day Moving Average, Last Week 26%, This Week 27%. This remains bearish.3. % of stocks above 200-Day Moving Average, Last Week 21%, This Week 29%. That's an improvement but still bearish.The long term metric (% Stocks below 200-Day MA) remains very bearish but above its 5-Week MA. That's promising. I'd like to see this above at least 40% before feeling comfortable.Conclusion.Overall, our market remains bearish, but we may be seeing a nascent counter-trend rally.It was interesting doing my research this weekend, all eleven sectors on the ASX show a positive MACD Histogram. It is not a highly reliable indicator, but suggests, at least, that downside momentum has eased. That could be signalling a move to the upside in the general market in the near future.I'll leave you with this thought:Interestingly, the stock market in 2022 has generally followed the downward path typical for a midterm election year since 1962, according to Dan Clifton at Strategas. The S&P 500 is down slightly more than the typical 19% intra-year decline, but the news improves if stocks stick to the script. Stocks have historically bottomed in October and rallied by an average of almost 32% in the next twelve months. Clifton notes that stocks have been positive in the year after every midterm election since 1942!Stay Safe.
Weekly Wrap, Week ended 14 October, 2022. Is the Bear...


Add XJO (ASX) to my watchlist
 (20min delay) (20min delay)
|
|||||
|
Last
8,212.2 |
Change
8.500(0.10%) |
Mkt cap ! n/a | |||
| Open | High | Low |
| 8,203.7 | 8,225.5 | 8,203.7 |
| XJO (ASX) Chart |