
Weekly Wrap - Week ending 3 June, 2022.
XJO Monthly Chart.
XJO is only three days into a new month (June).
The monthly chart remains range bound 6970-7630.
The chart is is essentially sideways as indicated by the two flat Supertrend lines, one above and one below the monthly candles.
The MACD Histogram also indicates a flat or sideways market, with the Histograms almost non-existent for the past four months - hugging the zero line.
Weekly Chart.
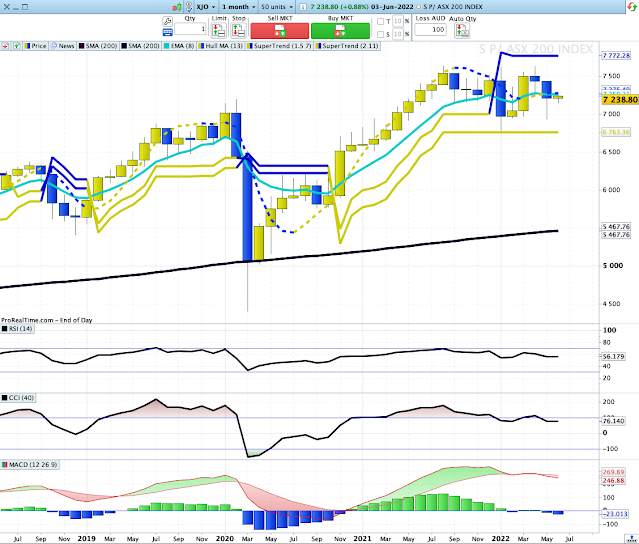
XJO was positive this week, +0.78%. This is its third week in a row to the upside.The chart is range bound, in concert with the monthly chart.Medium term, the chart remains bearish.. Hull MA13 is blue (bearish); two Supertrend lines are blue (bearish) and the chart is just below the 8-Week EMA (bearish). RSI and CCI are below their mid-lines (bearish). MACD Histogram is flat - non-trending.The chart is, however, rising from the lower edge of the rangeThe chart shows a trading range in round figures from 7630 to 6930. This week XJO finished at 7239.Daily Chart.
The daily chart is in a three-week up-trend, and has broken upside on the Donchian Channel.Both Supertrend Lines are bullish, Hull MA13 is bullish; Chart is above the 8-DEMA which is bullish.All of that looks hunky-dory, except - it all might just be a counter-trend rally. Looming just above are the 50-DMA, 200-DMA and horizontal resistance, all three lined up together.To prove its bullish condition, the chart has to surpass those three resistance levels. Maybe in the coming week?(Many successful trading strategies use the 200-DMA as a filter. Take long entries only if the instrument is above the 200-DMA, take short entries only if the instrument is below the 200-DMA.)
Sector Changes - past week.
This chart shows the performance of each sector (plus Gold Miners, XJO, BEAR and IAF) over the past week.The Market is relatively well balanced, with five sectors up, two flat and four down. Resources (Materials XMJ +3.83%. Energy XEJ +3.96%) were largely responsible for the positive ASX return this week. They remain the two sectors best placed for long trades.Financials (XXJ -1.3%) is the biggest sector in the market and a major drain on the performance of the XJO this week.New Highs - New Lows Cumulative.This is one of the important breadth indicators. Unless breadth is solidly positive, the market is always under threat.NH-NL Cumulative continues to fall and is now well under its 10-Day Moving Average, that's a big red danger sign for long-term investors.ASX Advance-Decline Line.This is another important indicator of breadth.
Like NH-NL Cum, ASX Advance-Decline Line is also bearish, but not quite as bleak as NH-NL Cum.It is, however, below its 10-DMA and its 20-DMA.% of Stocks above key moving averages.1. % of stocks above 10-Day Moving Average: Last Week 52%, This Week 53%.2. % of stocks above 50-Day Moving Average, Last Week 30%, This Week 31%.3. % of stocks above 200-Day Moving Average, Last Week 37%, This Week 38%This is another indicator of weak breadth. Despite the rise in the XJO the %age of stocks above key Moving Averages was relatively flat.Weak breadth is often a leading indicator for falls in the market.We need to see each of these parameters above 50% to feel comfortable about the XJO.Conclusion.
1. Monthly, Weekly Charts are non-trending - Daily Chart is in a medium term (15-Day) up-trend. We need to see all three Charts in sync.2.. Breadth is poor, so the most likely direction is down. If breadth continues to be poor, we can expect a break down from the ranges, and a continuation of the bear market. Perhaps not this week, but its not far off.
3. 50/200 DMAs are almost connected - that's stiff resistance. Any rise is likely to be short-term when the XJO hits dual resistance of those two major MAs.
Weekly Wrap - Week ending 3 June, 2022.XJO Monthly Chart.XJO is...


Add XJO (ASX) to my watchlist
 (20min delay) (20min delay)
|
|||||
|
Last
7,796.0 |
Change
26.600(0.34%) |
Mkt cap ! n/a | |||
| Open | High | Low |
| 7,769.4 | 7,796.9 | 7,753.9 |
| XJO (ASX) Chart |