
Weekly Wrap. Week ended 8/3/24.
XJO, SP500 and Nasdaq making new all time highs this week. Dow Jones continues to lag - unable to break above its 20-Day MA.Leading the charge up this week in Australia have been Financials (XXJ) +3.32%, Information Technology (XIJ) +1.44%, Property (XPJ) +2.61% and Health +1.47%. Interestingly - not one of those four sectors has made all time highs. Financials (XXJ) made its all time high back on March, 2015, although XXJ is just a smidgin below its all time high. After making its all time high in March, 2015 - XXJ (drum roll please) then fell almost 30%. We're now at the 9th anniversary of that all time high. Is history about to repeat?
Even more interestingly, not a single sector made a new all time high this week. That's the power of averages and breadth.
What did make an all time high this week, was the Equal Weight Index as measured by Vaneck's Equal Weight ETF. Here's the monthly chart going back to 2019.
XJOWeekly Chart
This week, XJO finished at 7847, about 100 points up on the previous week.
The Bearish Rising Wedge remains in play. Dynamic Zone Stochastic is close to a "sell" signal. That occurs when the signal line closes below its upper band. Other indicators are showing negative divergences.
Daily SP500 Chart.
This has been an extra-ordinarily long bull rally on the SP500. It began at the end of October, 2023 and has since risen >25%.
During that period, RSI has not fallen below its 50 line (mid-line) and the chart has not broken below the narrow Bollinger Bands (20/0.5). We'll know when this trend finishes when we see a break by the RSI below 50 and a break by the chart below its narrow Bollinger Bands.
Friday saw a big bearish engulfing candle on the SP500 so a pull-back seems imminent. We'll see if the buy-the-dippers come in again at the 20-Day MA or
we see significant break-downs in the RSI and narrow Bollinger Bands.
What's been happening this week and this month in the Australian Sectors.
- Sector Changes last Four Weeks
The sectors are broken up into groups: Cyclical, Sensitive and Defensive. In a Bull Market we expect the Cyclical and Sensitive Sectors to out-pace the Defensives. And that's what this graph shows. Cyclicals are up an average of 4.92%. Sensitives up 4.83%. Defensives down -0.57%. There are anomalies, notably the Resources. Materials -1.54% and Energy -3.65%. That's a result of the peculiar structure of the Australian market where the Resources are strongly influenced by economic activity in China and not the local economy.
The notable outlier is Information Technology, up +20.14% in the past four weeks - influenced, no doubt, by the big rises in the U.S. Tech sector.
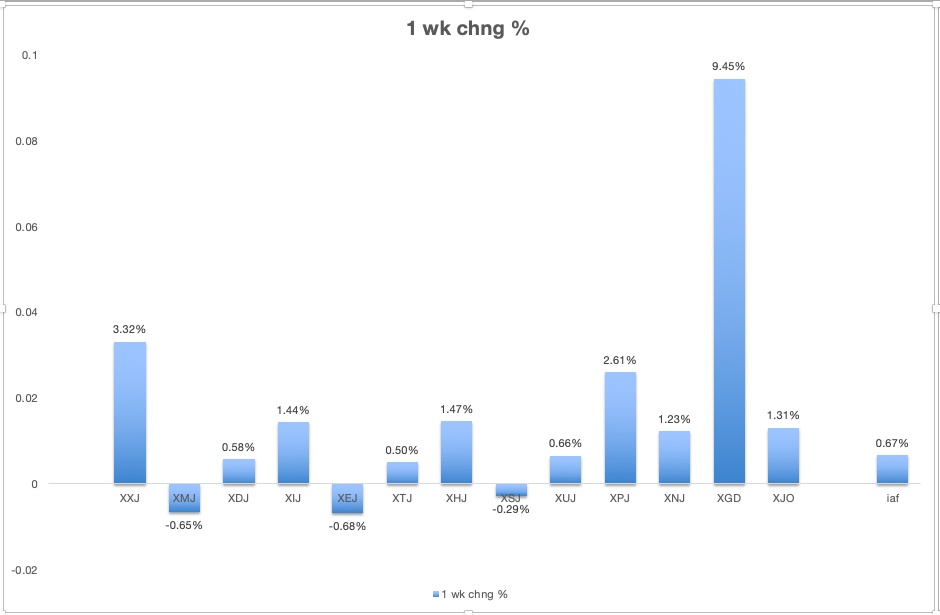
2. Sector Changes this Week.
The Big Bazooka this week was Gold Miners, up 9.45%. Now Gold Miners (XGD) is actually a sub-section of XMJ but that positive result in XGD wasn't enough to lift XMJ into positive territory. XMJ down -0.65%. It was joined in negative territory by the other Resources Sector, XEJ, down -0.68%. The only other negative sector was Staples (XSJ), down -0.29%.
Doing much of the heavy lifting this week was Financials (XXJ) up +3.32%, joined by its close sibling, Property +2.61%. (It's not that long ago that Property was once part of Financials which had the ticker symbol XFJ). XHJ (Health) had a revival of fortunes after a recent slump, +1.47%. XIJ wasn't as robust this week as in other recent week, up +1.44%. (I have to wonder if we aren't seeing some rotation in the sectors going on.)
GDX Chart
Gold Miners ETF has now been up seven days in a row. Gold was up again in the U.S. on Friday night so we will probably see another day up on Monday in Australia.
Friday was a wide range day in Australia so a fair amount of volatility is entering the Gold Miners. The chart is at the top of its Value Zone - that's the wide shaded rectangle. That represents about 70% of trading activity in Gold Miners. So it could be ready for a rest - a consolidation or some pull-back.
Long-Term Trend.
Cumulative New Highs minus New Lows provides a handy guide to the long term trend for long term investors. It is currently headed up and above its 10-Day MA - bullish. Stay with the trend.
Conclusion.The trend in the broad market is up - stay with the trend.
So far, there's not much indicating that the current up trend is ready to reverse. That can change in an eye-blink.
Friday night saw a bearish candle on the SP500 which may or may not be the beginning of the end for this bull market.
We'll know when the trend has changed by seeing if RSI on the SP500 falls below 50 and the chart falls below the narrow Bollinger Bands.
Good luck.
Indices 4/3, page-68


Add XJO (ASX) to my watchlist
 (20min delay) (20min delay)
|
|||||
|
Last
7,959.3 |
Change
69.700(0.88%) |
Mkt cap ! n/a | |||
| Open | High | Low |
| 7,889.6 | 7,969.1 | 7,889.0 |
| XJO (ASX) Chart |