
Options Expiry in the U.S. Major indices fall. Energy flat. Gold down.
Funny business occurs on Options Expiry Day in the U.S. with high volumes and indices jerked around. OE Day is often a deceptive guide. Despite major indices being down, Small Caps Index was up - that might be a better guide to action on Friday in the U.S.
Note that Op Ex Week tends to have a posiitve bias, but Op Ex day has a negative bias. The weekly bias didn't happened for this Op Ex period. For the week, SP500 down -0.13%. The negative bias for SP500 did work out, SP500 down -0.65% on Friday.Dow Jones -0.49%. SP500 -0.65%. Nasdaq -0.96%. Small Caps +0.49%. Regional Banks +0.72%.
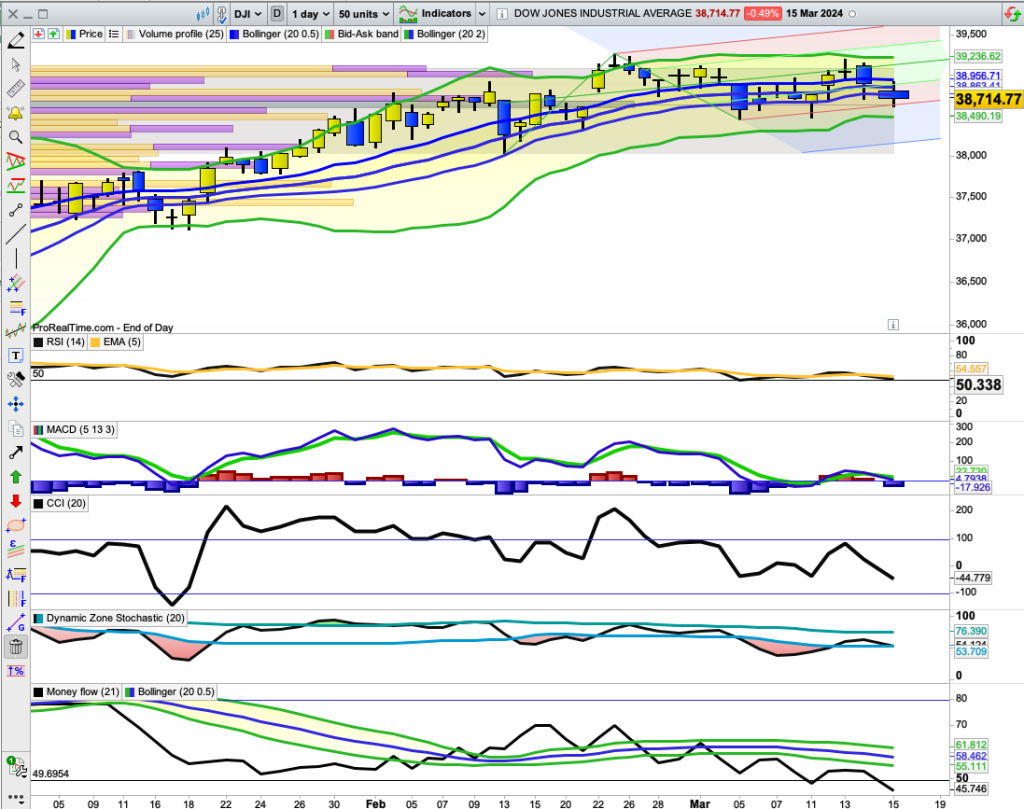
Dow Jones and Nasdaq both dropped below their 20-Day MAs. That's a dangerous level for Indices.
Dow Jones Chart.Dow Jones is teetering on the edge. It closed below the narrow Bollinger Bands (20/0.5) as it did on 5 March, and then recovered.
Indicators are mixed. RSI 14 remains above its mid-line, MACD (5/13/3) remains above its zero line. CCI is below its zero line. Stochastic is above its mid-line. Money Flow is below its mid-line. We need to see more uniformity in the Indicators before calling an end to the up-trend. That could occur if Dow Jones has a substantial fall on Monday.
Commodities.Commodities Index up +0.35%. Energy flat 0.00%. Base Metals continued its stong bull rally, up +1.06%. Agriculture +2.17. Gold -0.32%.
Gold is in a descending triangle pattern. Look for a break out of the triangle (up or down) for further direction.
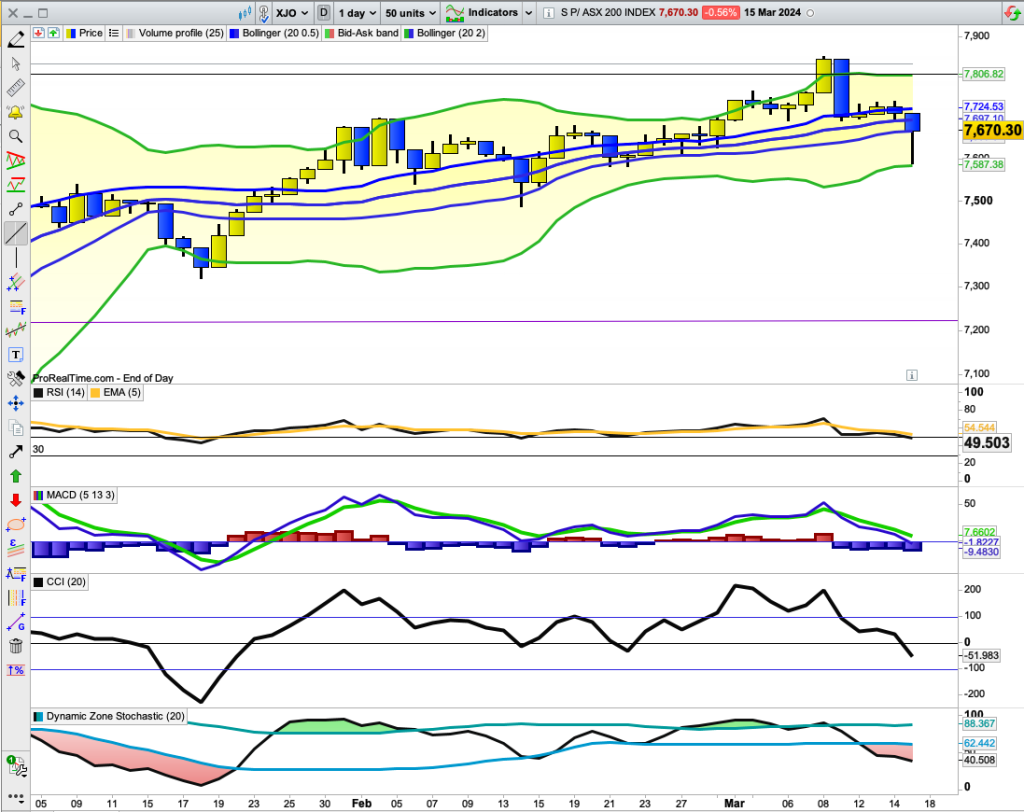
In Australia yesterday, the ASX pulled off a remarkable rebound after being down about -1.5%, it finished down -0.56%.
Yesterday's rebound looks like the completion of an ABC pull-back. The chart finished at the lower level of the narrow Bollinger Bands (20/0.5) after rebounding off the lower level of the standard Bollinger Bands ((20/2). Indicators are below their relative zero or mid-lines - which is a negative. In the case of the RSI, the fall below its mid-line is marginal.
Look for carry-through buying on Monday from Friday's finishing level of 7670.3. If we don't see carry-through buying on Monday, then XJO is in trouble.
Good luck
RB
Options Expiry in the U.S. Major indices fall. Energy flat. Gold...


Add XJO (ASX) to my watchlist
 (20min delay) (20min delay)
|
|||||
|
Last
8,214.5 |
Change
-8.500(0.10%) |
Mkt cap ! n/a | |||
| Open | High | Low |
| 8,223.0 | 8,228.3 | 8,200.0 |
| XJO (ASX) Chart |