All Roads Lead To Gold
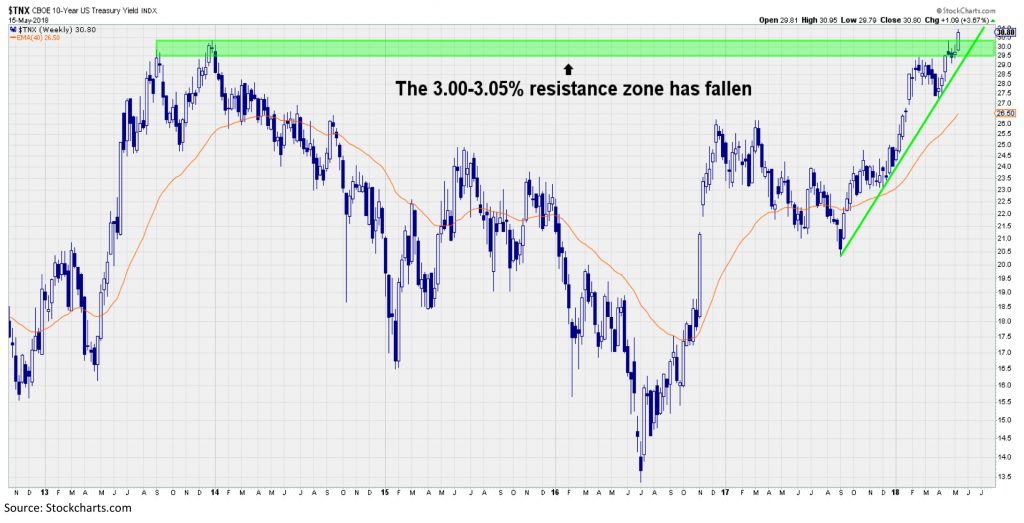
May 16 (King World News) – This is from Andrew Adams at Raymond James: 10-Year U.S. Treasury Rate Hits Multiyear High – We wrote in previous weeks that the 3.00-3.05% zone in the 10-Year U.S. Treasury yield might offer some resistance but that it would likely fall sooner rather than later. Well, that has now happened as the 10-Year has shot up to around 3.10%. The path of least resistance certainly looks to be on the upside for rates.
10-Year Treasury Breaks Out, And…
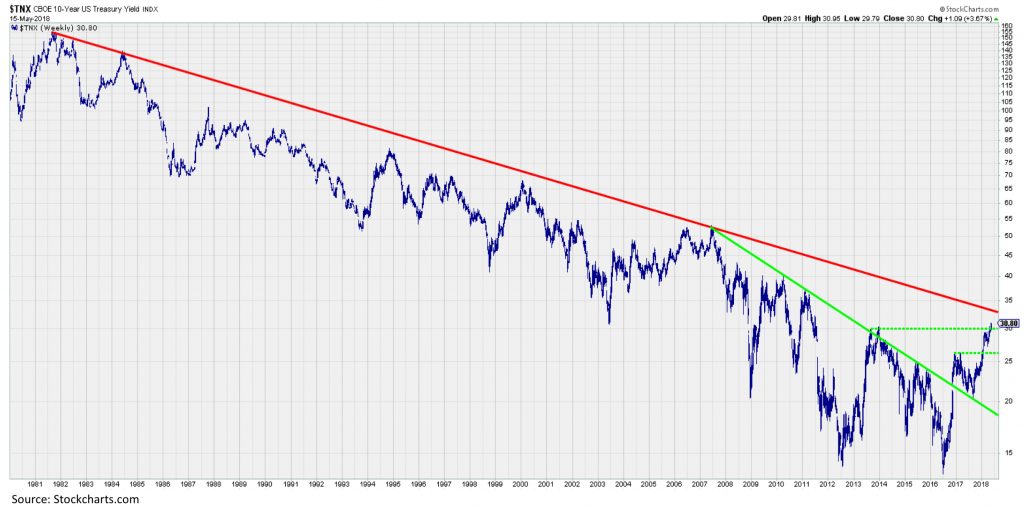
Long-Term Resistance Now in Play – With the breakout above 3.05%, we now expect the 10-Year will look to move toward the long-term downtrend line that has capped it going all the way back to the early 1980s (red line). The exact level will decline a bit each week but appears to currently sit somewhere in the 3.25- 3.30% range.
Bond Collapse Nears As US 10-Year Treasuries Prepare To Assault Multi-Decade Trendline
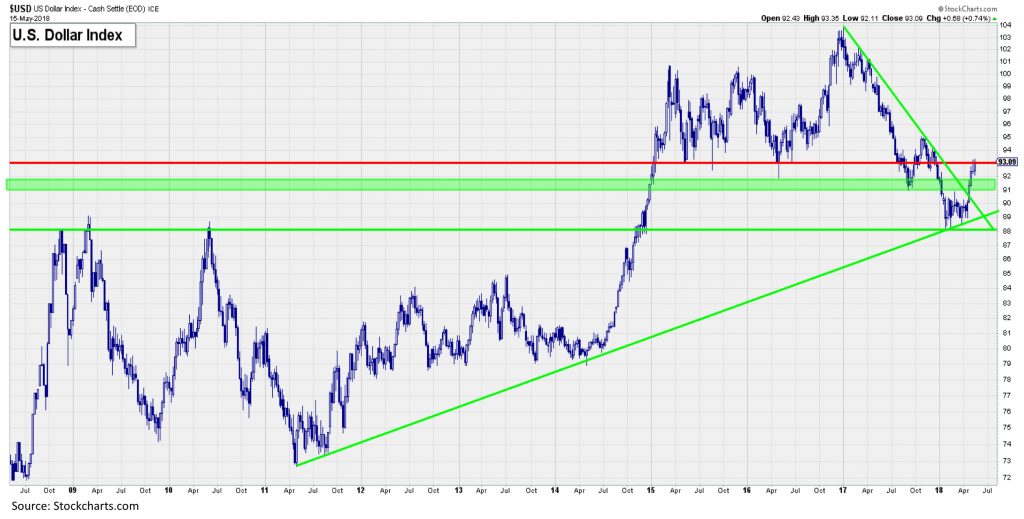
U.S. Dollar Battling Resistance Around Expected Level – The strength in the U.S. Dollar has received quite a bit of attention recently, and rightly so given how impactful it is on world markets. Two weeks ago, we wrote that the 93 level in the U.S. Dollar Index was the most likely resistance area, and so far it does appear to be giving the dollar some trouble. The downtrend since around the start of 2017 has broken, however, so it does look like the dollar wants to at least try to go higher.
US Dollar Index Runs Into Resistance
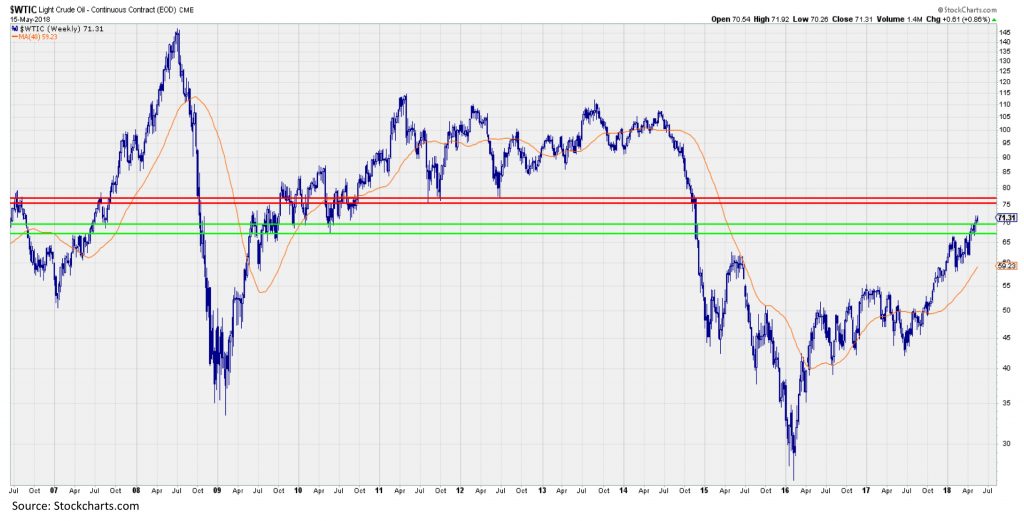
Stronger Dollar Not Stopping Oil Prices – The rise in crude oil has been one of the other major stories in recent weeks, and the commodity has now cleared the important $70 level (using WTI).
Massive Oil Surge Will Turbocharge Inflation Pressures
Oil continues to be a little overbought given its strong rally from the low $40s over the last year, but there does not appear to be much obvious resistance again until closer to $75.
ARD Price at posting:
2.5¢ Sentiment: Buy Disclosure: Held
A personalised tool to help users track selected stocks. Delivering real-time notifications on price updates, announcements, and performance stats on each to help make informed investment decisions.


 (20min delay)