Just letting the common-sense investors know that the chartists are as equally frustrated that this ABN sell has muddied the waters.
The worse case scenario has played out By using the Andrews pitchfork midline . in a bear market there was approx a 60% chance the stock would reach the midline in retrace, This also corresponds and intersects with a 50% long term (fibonacci )retrace level.
While these things can have an uncanny accuracy, there are also players well aware of these levels who will manipulate or shake the tree and cause a whipsaw in price, the chart shows 42 as the previous recent low 45 is the 50% and should have been a support level imo.
In candle stick read. if it can close with a lower shadow at 45
It will be the start of evidence the base is in with a double bottom (rejecting 43 as oversold) this fits with the stochastics being in the minus 20 oversold level,
Now Im exposed and zinxed it. watch the DUMP.....lol
next support is around 37 ?
My Buy is a close above the trailing red 14 period exponential moving average(just below 50)
I have other indirect interests.(family)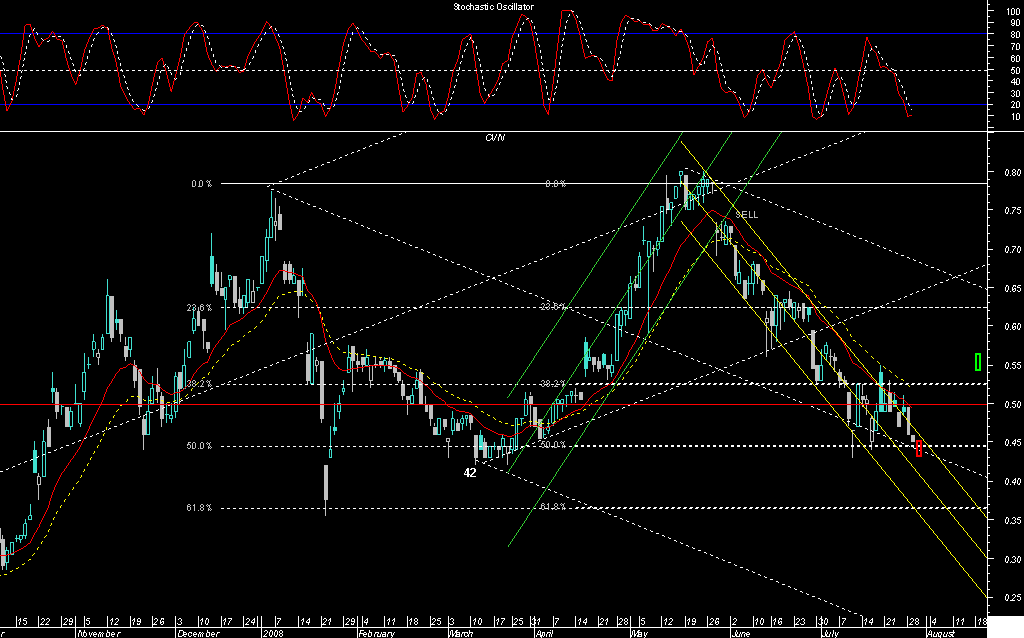
chart


Add CVN (ASX) to my watchlist
 (20min delay) (20min delay)
|
|||||
|
Last
19.0¢ |
Change
-0.005(2.56%) |
Mkt cap ! $339.8M | |||
| Open | High | Low | Value | Volume |
| 19.0¢ | 19.5¢ | 19.0¢ | $113.1K | 595.2K |
Buyers (Bids)
| No. | Vol. | Price($) |
|---|---|---|
| 3 | 230333 | 19.0¢ |
Sellers (Offers)
| Price($) | Vol. | No. |
|---|---|---|
| 19.5¢ | 393982 | 5 |
View Market Depth
| Last trade - 16.10pm 14/06/2024 (20 minute delay) ? |

|
|||||
|
Last
19.3¢ |
Change
-0.005 ( 1.32 %) |
||||
| Open | High | Low | Volume | ||
| 19.0¢ | 19.3¢ | 19.0¢ | 263992 | ||
| Last updated 15.40pm 14/06/2024 ? | |||||
| CVN (ASX) Chart |