Iron Ore Is Heading for Its Worst Week Since 2016
Bloomberg News,9 August 2019 3:57 PM
Iron ore’s tumultuous week extended into Friday, with the steelmaking material having its worst week since 2016 on concerns demand is slowing just as supply picks up.
Futures in Singapore resumed losses below $90 a ton, taking this week’s slump to 14%. Benchmark spot prices fell to the lowest since April. Iron ore’s getting pummeled by a battery of bearish factors, including slowing demand in China, global trade tensions, and a rebound in supplies following major disruptions in Brazil and Australia during the first half.
“Some large trading firms are dumping holdings at low prices, and there is no sign of prices bottoming out,” Shanghai Cifco says in note. Steel mills in China are “remaining on the sidelines” on expectations for more declines, it said.
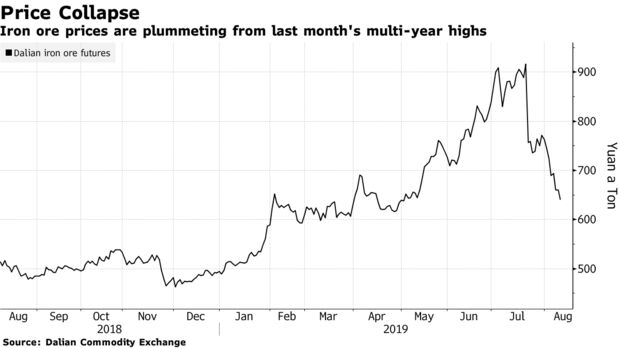
Iron ore has collapsed as the drivers that sent prices to the highest in five years just last month swiftly reverse. A supply shortage and record Chinese steel output have given way to a recovery in exports from the world’s top shippers, growing headwinds to China’s consumption and a rise in the country’s port stockpiles. Australia’s central bank said Friday it expects prices to decline further, adding to warnings from China’s top steel association earlier this week.
Chinese mills are also grappling with a plunge in the currency after China weakened its yuan reference rate for a seventh day against the dollar, a move that erodes steelmakers’ purchasing power and underscores jitters over domestic growth and geopolitical tensions. A drop in steel prices in China isn’t helping, with margins already pushing into negative territory despite relief from lower raw materials prices.
Prices
- Iron ore in Singapore -2.7% to $88.23/ton
- Futures on Dalian Commodity Exchange close -3.3% at 639 yuan/ton, -12% this week
- Rebar -2.2% to 3,591 yuan/ton on Shanghai Futures Exchange, -5.9% this week
- Hot-rolled coil -4% this week to 3,598 yuan/ton on SHFE
Miners’ shares retreated in Australia, with Fortescue Metals Group Ltd. declining 1.1%. Rio Tinto Group fell 0.9%, falling for an eighth day in the longest streak since 2015.
Among the recent iron ore market developments:
- Fortescue flagged weaker second-half demand in China, although Chief Executive Officer Elizabeth Gaines cautioned that it will still be up year-on-year.
- Roy Hill Holdings Pty is aiming to lift shipments to a run rate of 60 million tons a year.
- Iron ore prices are expected to drop in a volatile fashion as steel production seen falling, according to the China Iron & Steel Association.
- A drop in China’s producer prices signals the industrial sector is slipping back into deflation, according to Bloomberg Economics. This damps enterprises’ profits, especially in upstream businesses, and adds more pressure on the People’s Bank of China to cut interest rates.
- Iron ore may stabilize near $100/ton given significant production losses in key producing countries, according Australia & New Zealand Banking Group Ltd. The market will remain under supplied until 2020, offsetting some concerns about weaker demand.
— With assistance by Martin Ritchie
.
Iron Ore Is Heading for Its Worst Week Since 2016Bloomberg News,...


Add to My Watchlist
What is My Watchlist?
 (20min delay) (20min delay)
|
|||||
|
Last
$4.20 |
Change
0.040(0.96%) |
Mkt cap ! $2.239B | |||
| Open | High | Low | Value | Volume |
| $4.21 | $4.31 | $4.14 | $15.79M | 3.748M |
Buyers (Bids)
| No. | Vol. | Price($) |
|---|---|---|
| 1 | 18900 | $4.19 |
Sellers (Offers)
| Price($) | Vol. | No. |
|---|---|---|
| $4.22 | 9700 | 1 |
View Market Depth
| Last trade - 16.10pm 08/08/2025 (20 minute delay) ? |
| CIA (ASX) Chart |