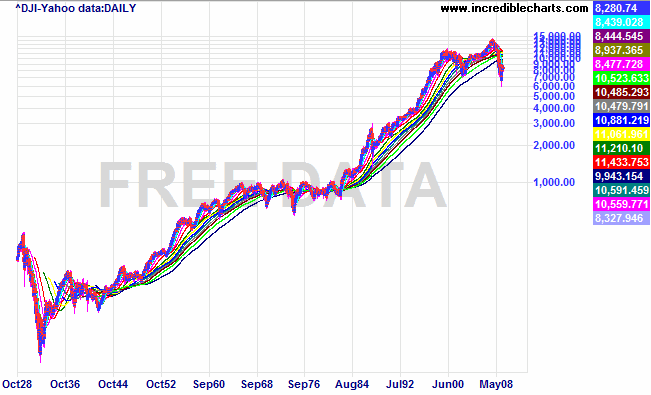
this is my long term view of the djia. i believe that my moving averages do a good job of highlighting differences and similarities to past trends. these are ultra long m.a. that measure trends over years rather than days.
the chart highlights the present similarities to the 1930s and 1970s. it also shows that while the 1987 crash was dramatic, it was still within an overall bull trend.
from my experience working with moving averages in short term trading, imo, the angle of the 200 day moving average isn't in a supportive position to maintain a sustaining rally. that is, it still needs time. that doesn't necessarily mean we need to make new lows. i am open to the idea that march 2009 was THE significant low....but the current market doesn't excite me much and suggests that my view of the 200 day m.a. may be correct.
for all these reasons ...and more, i still like a 1940 type scenario playing out...but am willing to see what the market has to offer.
what i am saying here is that while i favour the bearish side, i am not stupidly committing myself either way...as it is quite possible that after a period of consolidation, the market continues to run up as it did from the 1974 lows. however, in the current environment, i am not sure if there is sufficient momentum to sustain such a move.

- Forums
- ASX - By Stock
- XJO
- is it forming an ugly head and shoulders
is it forming an ugly head and shoulders, page-76
-
- There are more pages in this discussion • 29 more messages in this thread...
You’re viewing a single post only. To view the entire thread just sign in or Join Now (FREE)
Featured News
Add XJO (ASX) to my watchlist
 (20min delay) (20min delay)
|
|||||
|
Last
7,971.6 |
Change
-64.900(0.81%) |
Mkt cap ! n/a | |||
| Open | High | Low |
| 8,036.5 | 8,036.5 | 7,923.6 |
Featured News
| XJO (ASX) Chart |


