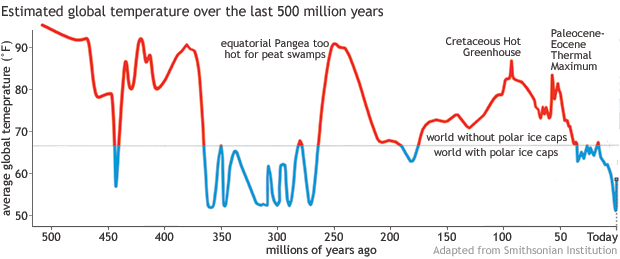
I would probably put a time limit to your comment (as 007 said 'never say never again'):Preliminary results from a Smithsonian Institution project led by Scott Wing and Brian Huber, showing Earth's average surface temperature over the past 500 million years. For most of the time, global temperatures appear to have been too warm (red portions of line) for persistent polar ice caps. The most recent 50 million years are an exception. Image adapted from Smithsonian National Museum of Natural History.
I would probably put a time limit to your comment (as 007 said...
-
- There are more pages in this discussion • 50 more messages in this thread...


You’re viewing a single post only. To view the entire thread just sign in or Join Now (FREE)