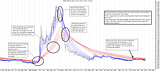
Hi SaberX, below is an educational chart i did a while back...obviously not an HGO chart but it explains the Multiple moving average (MMA) charts for a better understanding...Hope it helps
If you are new to charting, maybe you can look at prorealtime charts they are free and have many indicators...and read, read, read...
If you like the MMA chart google a man named daryl guppy, read all his books they are great...he also has a few handy dvd's.
MMA goes a lot further than i have explained in the chart below, this is just the basics...
MMA Educational charts.![]()
is this a breakout?, page-11
Featured News
Add HGO (ASX) to my watchlist
|
|||||
Last
6.2¢ |
Change
0.001(1.64%) |
Mkt cap ! $129.9M |
Open | High | Low | Value | Volume |
6.1¢ | 6.3¢ | 6.1¢ | $87.25K | 1.401M |
Buyers (Bids)
No. | Vol. | Price($) |
---|---|---|
6 | 314647 | 6.2¢ |
Sellers (Offers)
Price($) | Vol. | No. |
---|---|---|
6.3¢ | 91100 | 1 |
View Market Depth
No. | Vol. | Price($) |
---|---|---|
5 | 303647 | 0.062 |
9 | 1371155 | 0.061 |
17 | 1599781 | 0.060 |
10 | 974766 | 0.059 |
7 | 761871 | 0.058 |
Price($) | Vol. | No. |
---|---|---|
0.063 | 91100 | 1 |
0.064 | 385300 | 3 |
0.065 | 292592 | 2 |
0.066 | 285838 | 4 |
0.067 | 204750 | 3 |
Last trade - 16.10pm 26/07/2024 (20 minute delay) ? |
Featured News
HGO (ASX) Chart |