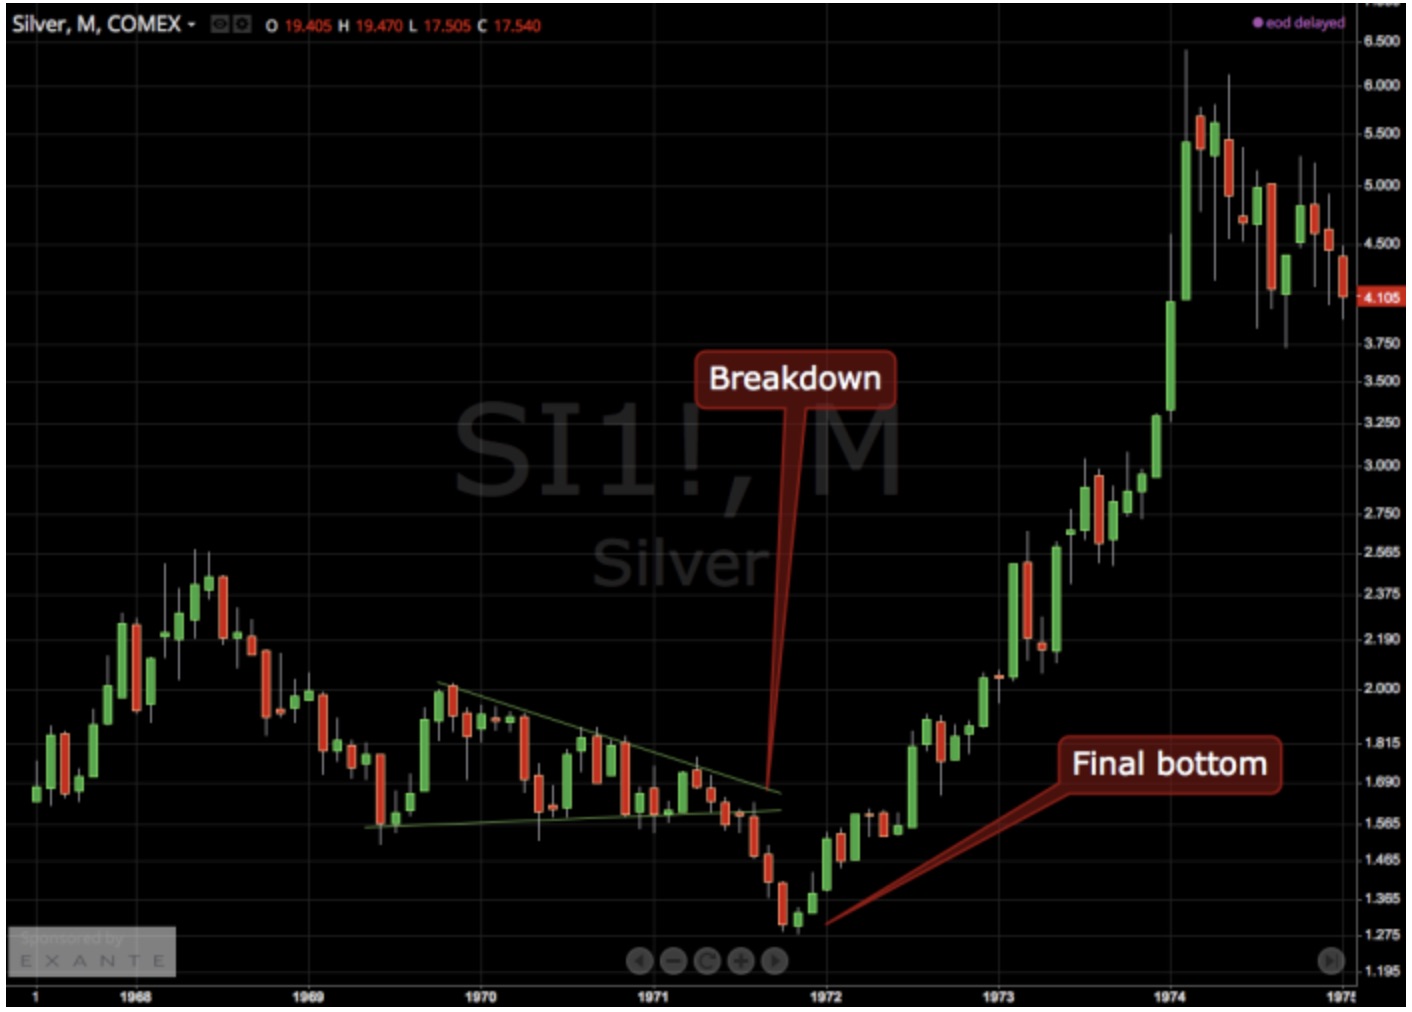
Silver broke down in 1971, then skyrocketed 5-fold in 1972-1973
Back then (1971), silver broke down and investors who only looked at the technical picture might have sold their positions before the historic rise…
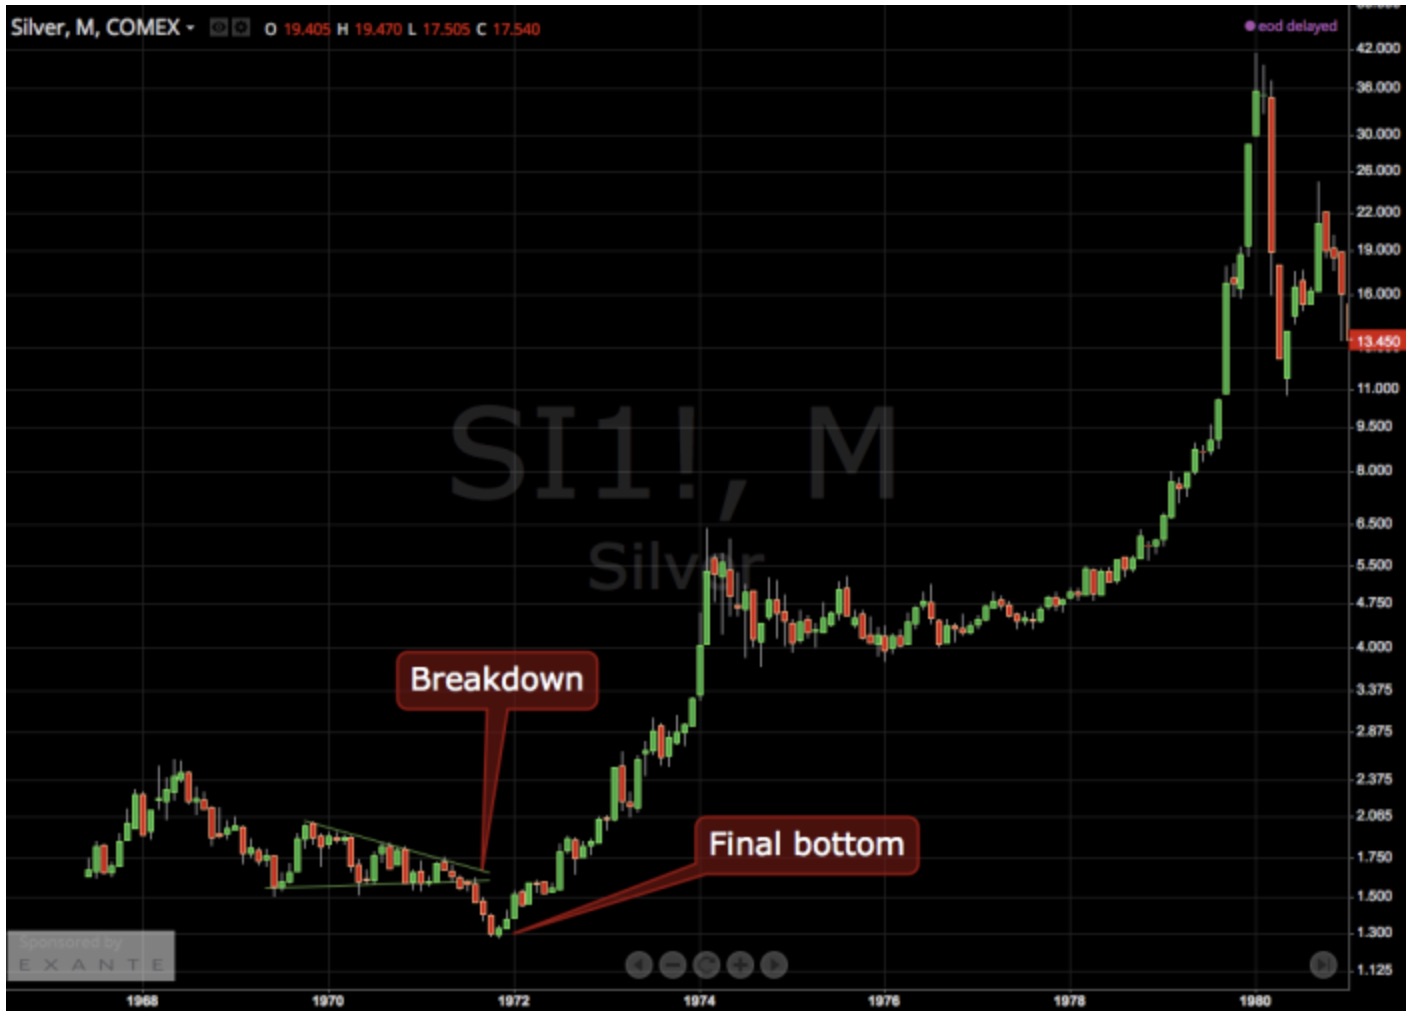
From the low in 1971 to the $50 high in 1980, the price of silver soared 40-times higher (see long-term chart below)!
After 1971 low, the price of silver skyrocketed 40-times higher!
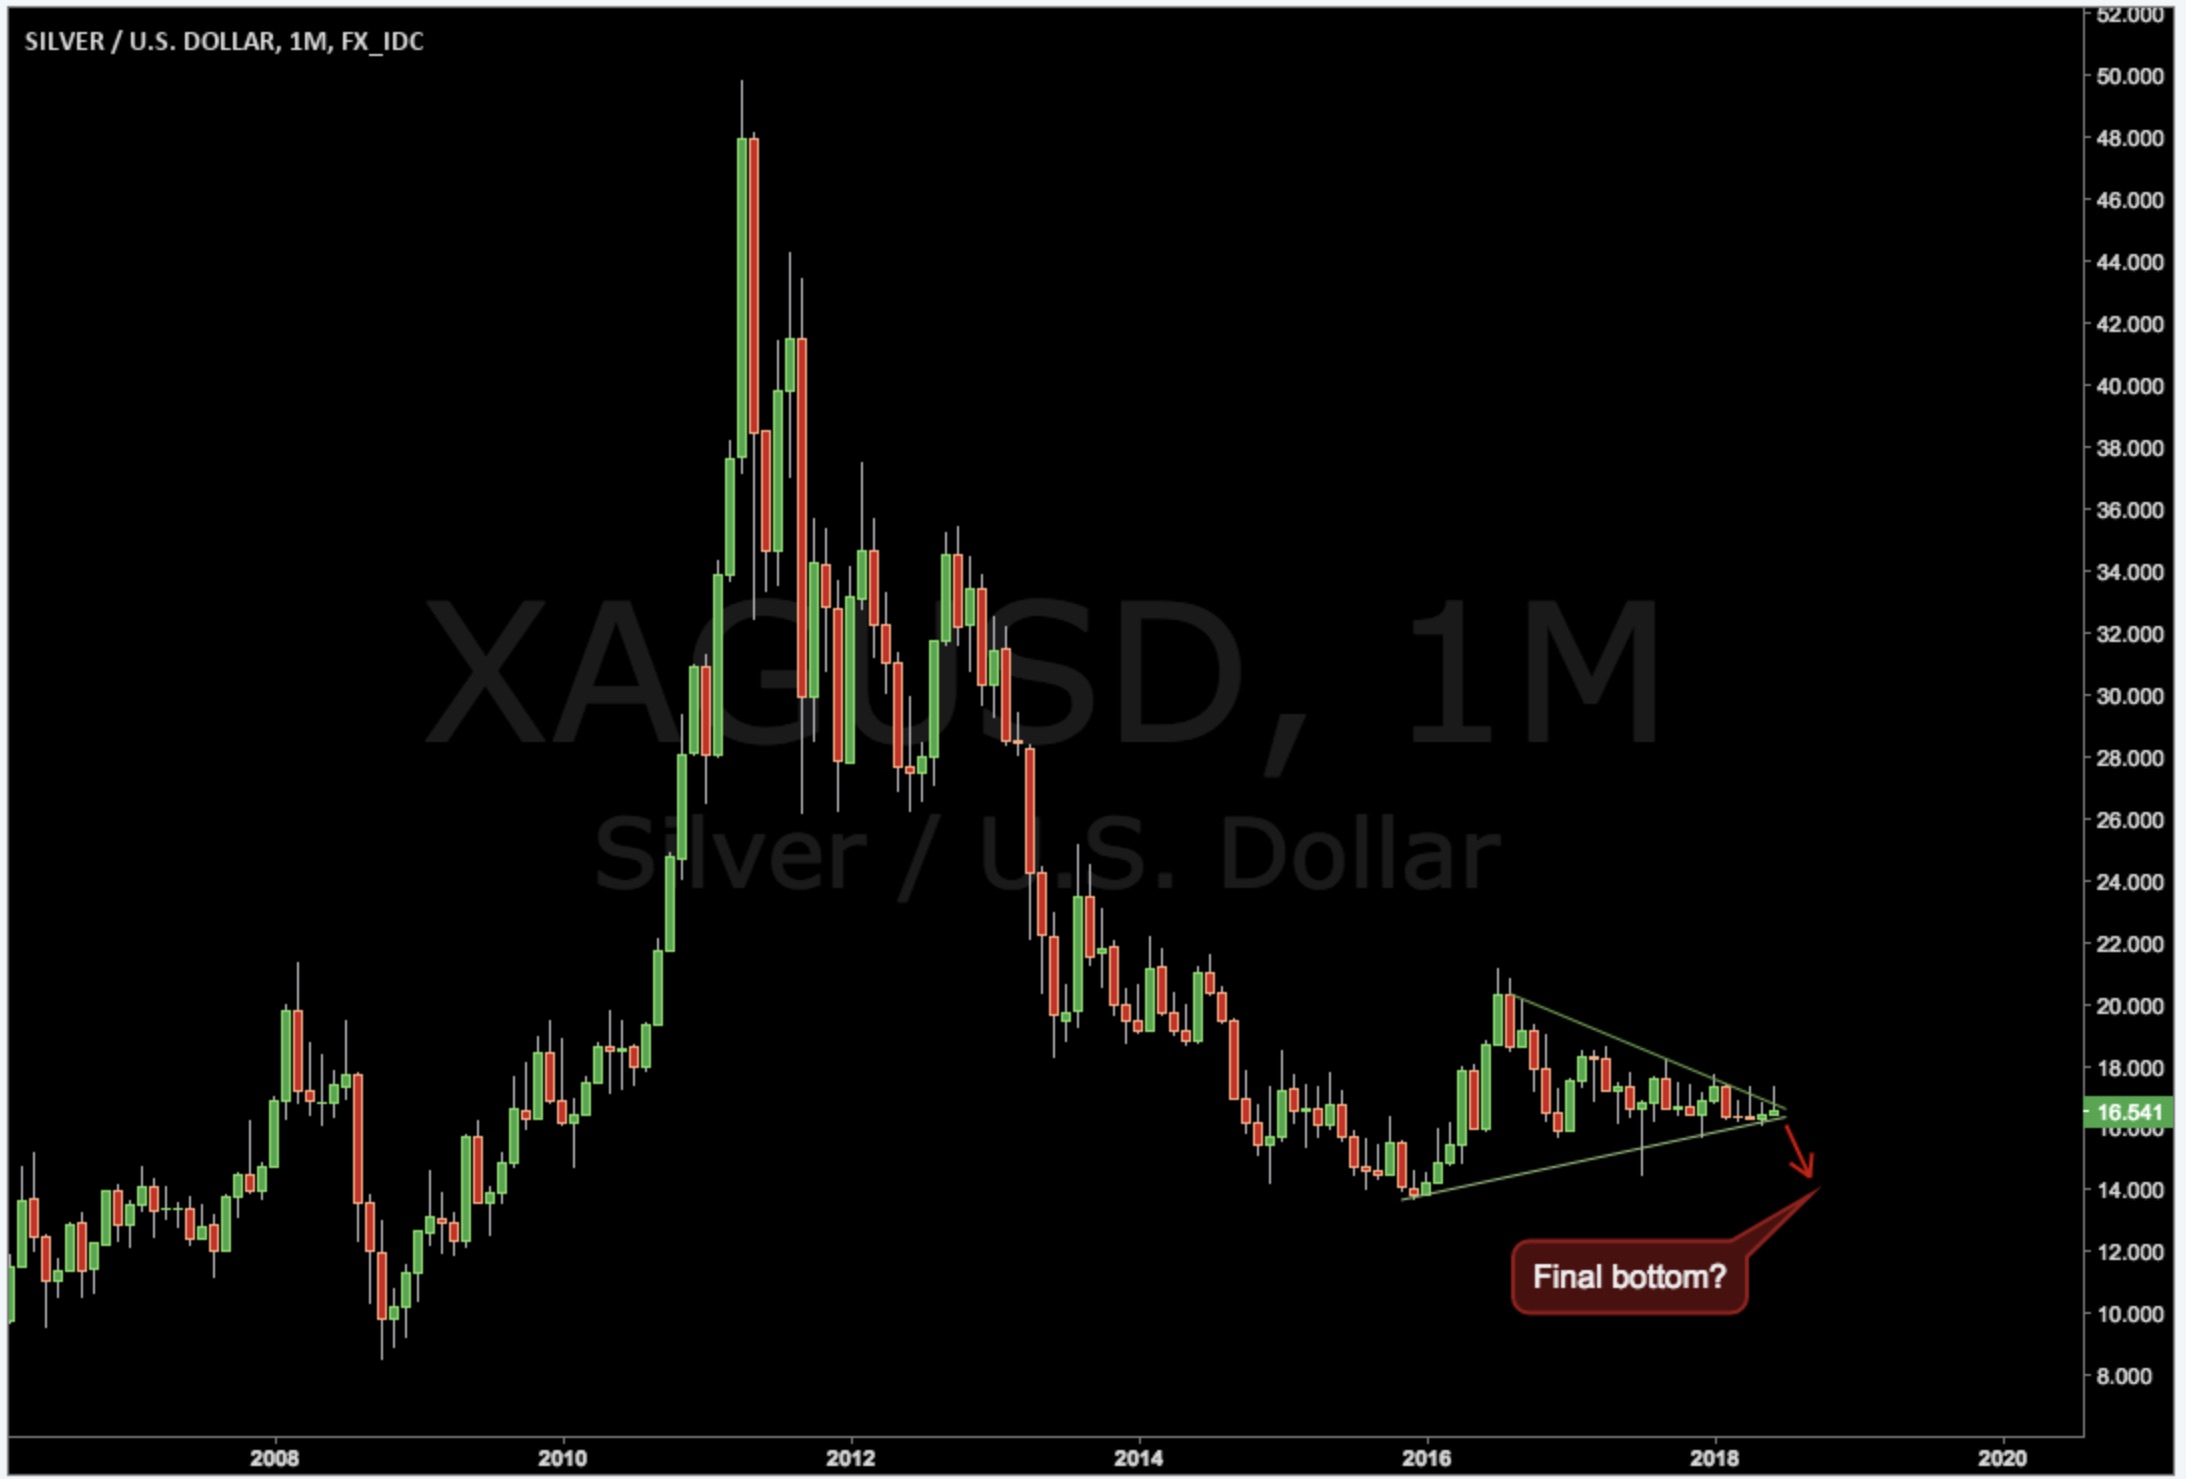
King World News note: What does David’s silver chart look like today? (See below).
Will the silver price break lower once again before skyrocketing?
King World News note: Will the silver price break lower once again before skyrocketing? Only time will tell.
David P. had this final note: “Regardless, in my opinion, a breakdown in the silver chart should be bought since the fundamentals look better than ever, as in 1971.”
ARD a screaming BUY at these prices, IMHO!
Silver broke down in 1971, then skyrocketed 5-fold in 1972-1973...


Add to My Watchlist
What is My Watchlist?
 (20min delay) (20min delay)
|
|||||
|
Last
2.2¢ |
Change
-0.001(4.35%) |
Mkt cap ! $36.89M | |||
| Open | High | Low | Value | Volume |
| 2.3¢ | 2.4¢ | 2.2¢ | $208.6K | 9.176M |
Buyers (Bids)
| No. | Vol. | Price($) |
|---|---|---|
| 19 | 3031312 | 2.2¢ |
Sellers (Offers)
| Price($) | Vol. | No. |
|---|---|---|
| 2.3¢ | 792703 | 4 |
View Market Depth
| Last trade - 16.10pm 15/09/2025 (20 minute delay) ? |
| ARD (ASX) Chart |