So much money printed. Excessive debt. Even pandemic! And gold failed to hold gains. But that’s how markets work, no matter what gold permabulls say. Image Source: Pixabay
Gold plunged yesterday, just as it was likely to. The fake reason? U.S. retail sales exceeded expectations. The real reason? A major downtrend.
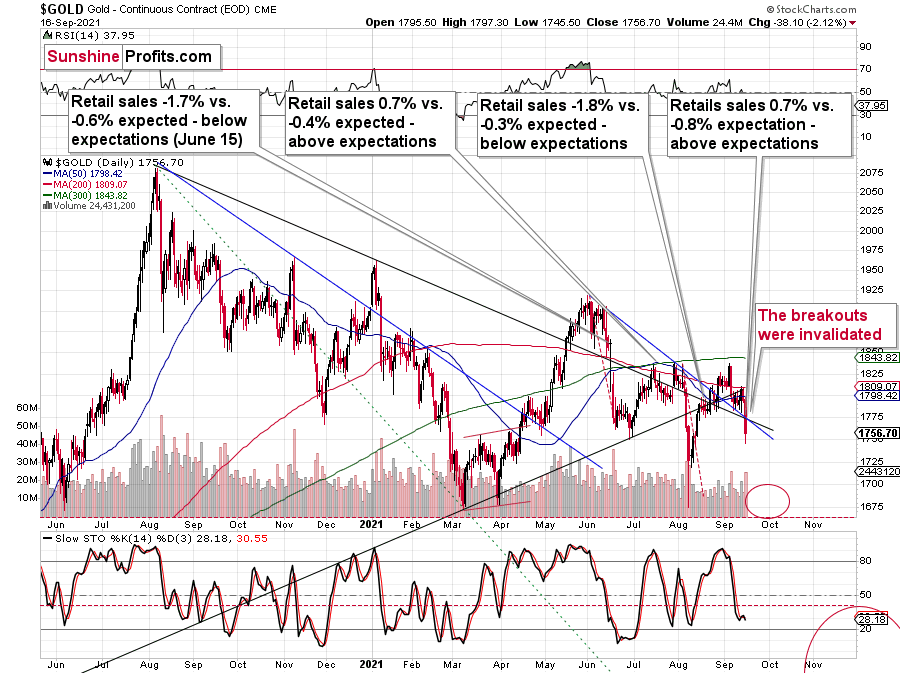
On the above gold chart, I added annotations that show what happened in the previous 3 cases after the retail sales reports. We saw the following:
gold declined after retail sales disappointed in June
gold topped after retail sales outperformed in July
gold paused its rally after retail sales disappointed in August
gold declined after retail sales outperformed in September
What should one make of that?
Nothing.
There is no clear link (and perhaps no link whatsoever) between U.S. retail sales and the price of gold. If gold had declined based only on great retail sales, then it surely should have soared based on disappointing retails sales in June, right? It plunged then.
For many weeks, months, and years, I’ve been writing that markets don’t need a trigger to move in a certain way. Getting one could speed things up, but the markets might eventually rally or decline on just about any piece of news, provided that they really “want to”. By markets “wanting” to move in a given way, I mean the fact that markets move in trends and cycles, and even if a given market has a very favorable fundamental situation for the long run, it doesn’t mean that it won’t slide in the short or medium term. That’s how markets work, and that’s been the case for decades, regardless of what gold permabulls might tell you.
Let’s face it, the monetary authorities around the world are printing ridiculous amounts of money, stagflation is likely next, and gold is extremely likely to soar based on that in the following years, just like what we saw in the 1970s.
But.
This is already the case – lots of money has been already printed, and the world has been suffering from the pandemic for well over a year. Gold should be soaring in this environment! Silver should be soaring! Gold stocks should be soaring too!
And what’s the reality?
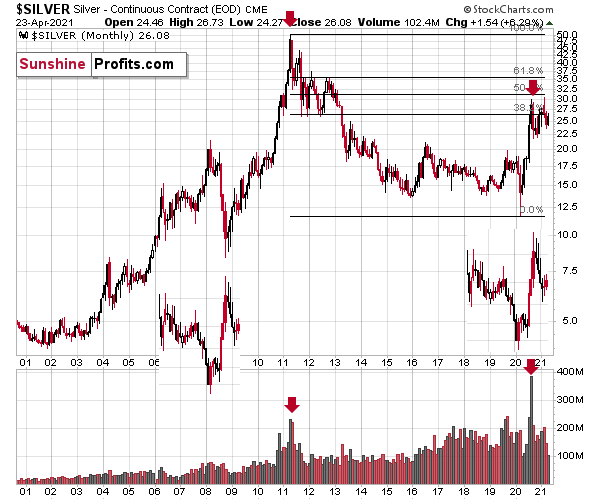
Gold failed to hold its gains above its 2011 highs. Can you imagine that? So much money printed. Excessive debts. Even pandemic! And gold still failed to hold gains above its 2011 highs. If this doesn’t make you question the validity of the bullish narrative in the medium term in the precious metals sector, consider this:
Silver – with an even better fundamental situation than gold – wasn’t even close to its 2011 highs (~50). The closest it got to this level was a brief rally above $30. And now, after even more money was printed, silver is in its low 20s.
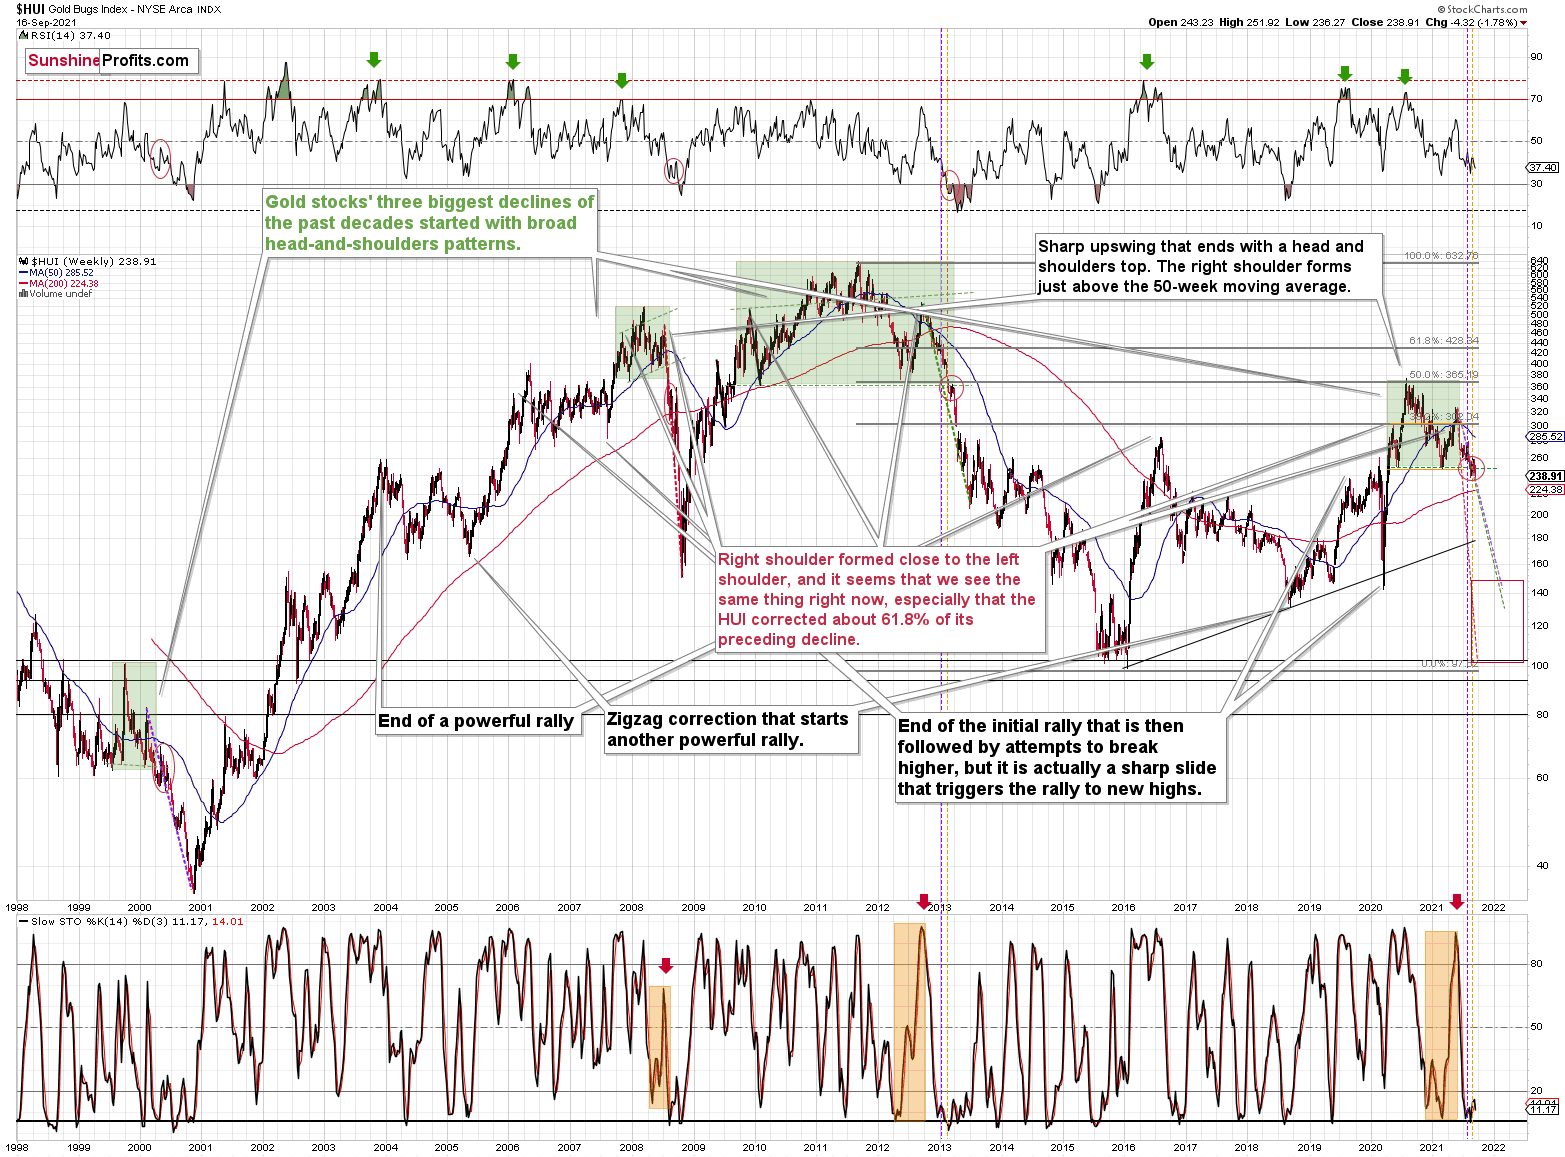
And gold stocks? Gold stocks are not above their 2011 highs, they were not even close. They were not above their 2008 highs either. In fact, the HUI Index – the flagship proxy for gold stocks – is trading below its 2003 high! And that’s in nominal prices. In real prices, it’s even lower. Just imagine how weak the precious metals sector is if the part of the sector that is supposed to rally first (that’s what we usually see at the beginning of major rallies) is underperforming in such a ridiculous manner.
And that’s just the beginning of the decline in the mining stocks. More to Come!
The breakdown below the broad head and shoulders pattern (marked with green) was verified. The previous three similar patterns (also marked with green) were followed by huge declines, and I copied the moves to the current situation (marked with dashed lines). This simple analogy tells us that the HUI Index could slide to the 100 – 150 range, meaning that it could even decline to its early 2016 low.
Can it really happen? With the precious metals market as weak as it is right now (from the medium-term point of view, not the long-term one) — of course.
On a short-term note, please take a look at what silver just did.
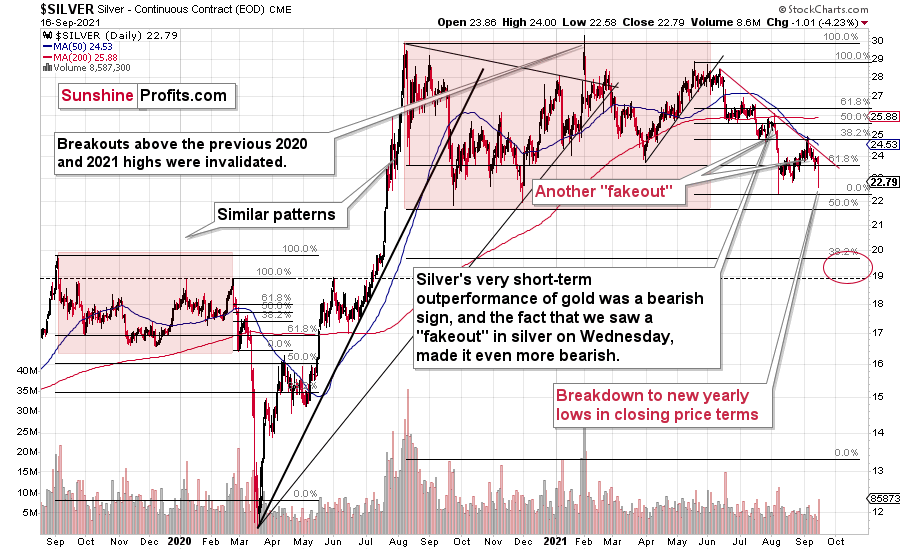
It broke to new 2021 lows in terms of the closing prices. Indeed, back in August, silver’s intraday low was lower, but it didn’t close as low. That’s a major confirmation of the bearish price forecast for silver.
Silver Price Prediction for September 2021
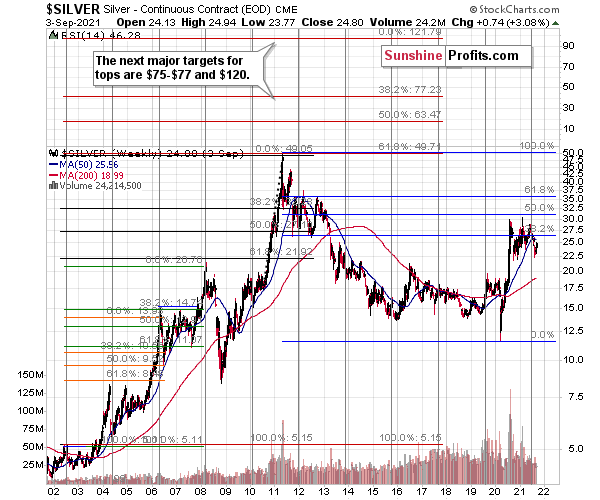
With silver’s long-term cycle implying a surge above $75 (and even $100) over the next several years, the white metal’s secular uptrend remains intact. However, with an epic collapse likely to precede the forthcoming Renaissance, volatility presents us with ample opportunities.
Case in point: silver cycles last roughly two years and the turning points culminate with extreme volatility in both directions. Sometimes ferocious rallies follow, and other times the white metal falls off a cliff. In the here and now, with silver approaching the end of its current cycle, a supreme climax could be around the corner. Moreover, when we combine the myriad of technical and fundamental indicators signaling the same outcome, the white metal could get cut in half over the next few months.
Please see below:
As for the short term, analyzing silver’s historical fakeouts has proven quite valuable. For example, while many investors chase the white metal’s upward momentum only to find little light at the end of the tunnel, I’ve warned on several occasions that falling for the seduction is an extremely costly mistake.
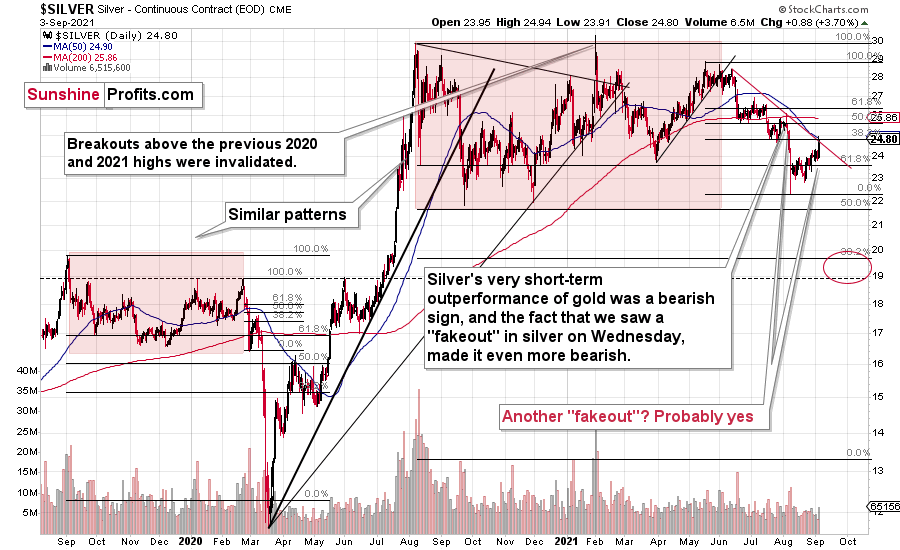
And last week, while silver rallied back above its previous 2021 lows, the white metal now faces resistance from a double top, its declining resistance line (the red line below) and the 38.2% Fibonacci retracement level. Moreover, silver also outperformed gold on Sep. 3 – and prior demonstrations of relative strength often ended with lower lows for the pair over the medium term. Thus, we may have just witnessed another one of silver’s famous fakeouts.
To that point, silver should challenge the $19 to $20 range in the coming months before a corrective upswing ensues. For context, the range coincides with the 61.8% Fibonacci retracement level and the September 2019 highs. To clarify: in my view, silver is very likely to soar in the following years, but timing matters, and ignoring cycles, trends, and technical patterns is what could make people lose a lot of capital.
Also, please note that gold is the canary in the coal mine, and the yellow metal’s behavior will likely signal the shift in silver’s sentiment.
Now, this is extremely important because if the GDXJ ETF plunges and silver doesn’t, we may shift our short position to the white metal. However, if the opportunity presents itself, we will keep you, our subscribers, updated.
For more context on silver’s self-similarity patterns, I wrote previously:
If you analyze the left side of the chart above, you can see that silver moved back and forth before breaking toward its September highs. However, after failing to complete the milestone, the white metal eventually collapsed. As a result, with the pattern on the right side of the chart eerily similar, investors’ optimism has occurred at what’s likely the worst possible time.
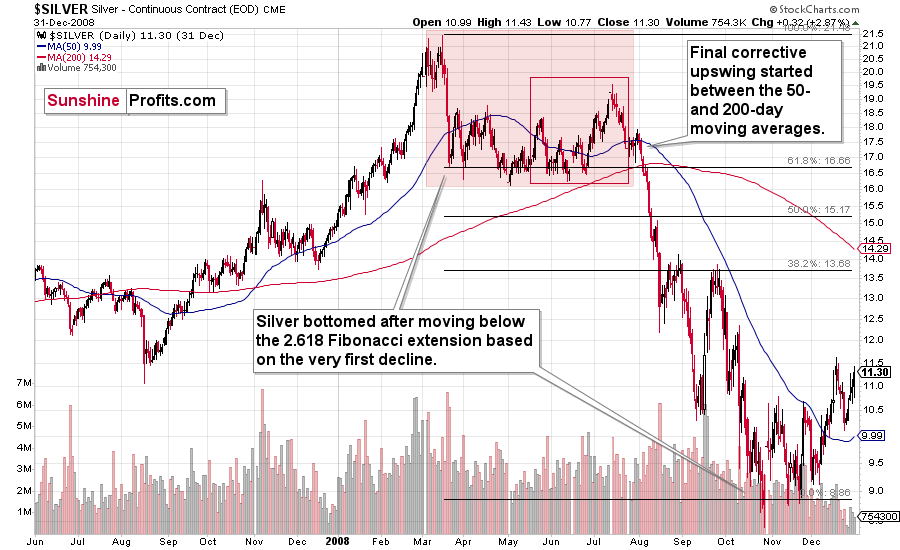
To that point, with its current behavior also mirroring 2008 – where silver fell below and then rallied back above its 50-day MA before plunging – the white metal remains on a journey of self-destruction.
If we zoom in on the white metal’s price action in 2008, you can see that an immaterial bounce also occurred right before silver fell off a cliff.
The final corrective upswing of early 2020 took place in very late February and early March, while the two – normal – tops that created the red-line rectangle formed more or less at the turn of the year and in late February. This year, it’s all taking place at almost exactly the same time of the year.
Let’s be realistic - so far, the analogy (to what happened in 2019 and 2020) might seem too unclear to be viewed as a reliable base for making a silver forecast.
But what if… What if there was a very similar pattern in the past that also preceded a massive decline? This would greatly increase the reliability of the above self-similarity.
There was indeed such a pattern!
That’s what silver did in 2008 before it declined.
The August 2007 – March 2008 rally (please note the interim top in November 2007 that was followed by a zigzag decline, more or less in the middle of the rally) is similar to the March 2020 – August 2021 rally (please note the interim top in June 2020 that was followed by a zigzag pattern, more or less in the middle of the rally).
Afterwards, we saw a double top in both cases that was followed by a sizable slide. Then silver formed a specific U-shaped broad top, where the final top was below the initial one (exception: in this case the forum-based rally took silver slightly above the previous high, but due to the specific / random nature of the move, it “doesn’t count” as something that invalidates the analogy).
After the top, silver declined, and the final corrective upswing took place approximately between the 50- and 200-day moving averages.
Please note that in both previous (2008 and 2020) cases silver then truly plunged, and it kept on declining until it moved below the 2.618 Fibonacci extension based on the initial downswing. The above charts illustrate that by showing the first decline at the 38.2% retracement (1 / 0.382 = approximately 2.618). Applying the same to the current situation (the initial decline took silver from below $30 to below $24) provides us with the minimum decline target at about $13.50. Will silver really decline as low? In my view, it’s imperative to watch other markets for indications as they might have more reliable targets (for instance gold), but I wouldn’t say that this target (or lower price levels) is out of the question. Of course, that’s just on a temporary basis – silver will likely soar in the following months and years (after this decline).
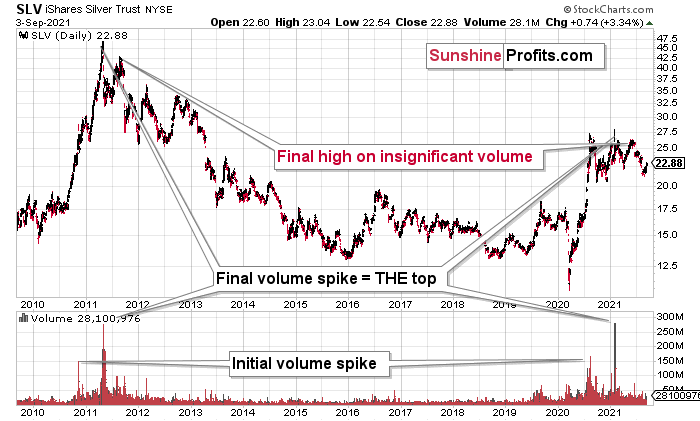
Highlighting the effect of WallStreetBets’ #SilverSqueeze, the SLV ETF’s volume spikes in 2020/2021 were nearly identical to the surges that we witnessed ~10 years ago. If you analyze the chart below, you can see that the massive inflows at the end of 2012 were not the beginning of a medium-term upswing. In fact, they coincided with silver’s final bounce before the white metal suffered a major decline.
Please see below:
mce-anchor
If you analyze the volume spikes at the bottom of the chart, 2021 and 2011 are a splitting image. To explain, in 2011, an initial abnormal spike in volume was followed by a second parabolic surge. However, not long after, silver’s bear market began.
SLV-volume-wise, there's only one similar situation from the past - the 2011 top. This is a very bearish analogy as higher prices of the white metal were not seen since that time, but the analogy gets even more bearish. The reason is the "initial warning" volume spike in this ETF. It took place a few months before SLV formed its final top, and we saw the same thing also a few months ago, when silver formed its initial 2020 top.
In addition, the SLV ETF is also following the 2011 playbook. Back then, the SLV ETF recorded an initial spike in price and volume and followed that up with a parabolic spike in both that marked THE top. This was then followed by one last spike in price on relatively average volume. To that point, if you focus your attention on the right side of the chart above, you can see that an identical formation is present. After an initial spike in price and volume, the big one occurred in early 2021. And with silver’s latest rally occurring on relatively average volume, the price action looks a lot like the calm before the 2011 storm.
That third average-volume top in 2011 was the final chance to sell silver above $40 and perhaps to short it. It could be the same right now, but with regard to the $25 price level. Of course, silver is likely to soar well above $50 and $100 in the following years, but currently, the analogy points to lower prices in the medium term.
The history may not repeat itself to the letter, but it tends to be quite similar. And the more two situations are alike, the more likely it is for the follow-up action to be similar as well. And in this case, the implications for the silver price forecast are clearly bearish.
Based on the above chart, it seems that silver is likely to move well above its 2011 highs, but it’s unlikely to do it without another sizable downswing first.
Similarly, silver’s inverse price action also has bearish implications. Nearly identical to the inverted formation that emerged from 2006 to 2009, today’s chart looks eerily similar to its predecessor.
While it’s more of a wild card, the above pattern shows that silver’s 2020 top plots are nearly identical to the inverse of the 2006-2009 performance. I copied the 2006 – 2009 performance right below the regular price movement and inverted it. I also copied this inverted pattern to the last few years.
The similarity is quite significant. And whenever a given pattern has been repeated, the odds are that it could also repeat in the not-too-distant future. Of course, there is no guarantee for that, but once the same market has reacted in a certain way to a specific greed/fear combination, it can just as well do it again. And these similarity-based techniques work quite often. So, while it’s not strong enough to be viewed as a price-path-discovery technique on its own, it should make one consider some scenarios more closely. In particular, this means that the declines in the prices of silver, gold, and mining stocks could be bigger and take longer than it seems based on other charts and techniques.
The above is also in tune with the implications of the sell signal from the MACD indicator on the monthly gold chart.
The only thing that comes to my mind which could – realistically – trigger such a prolonged decline would be a major drop in the general stock market. Given what I wrote above, the latter is quite possible, so I’ll be on the lookout for confirmations and invalidations of this scenario.
If history rhymes, silver could be in for a profound decline over the next few months (beyond my initial target). Moreover, the development would increase the duration of the precious metals’ bear market (also beyond my initial forecast).
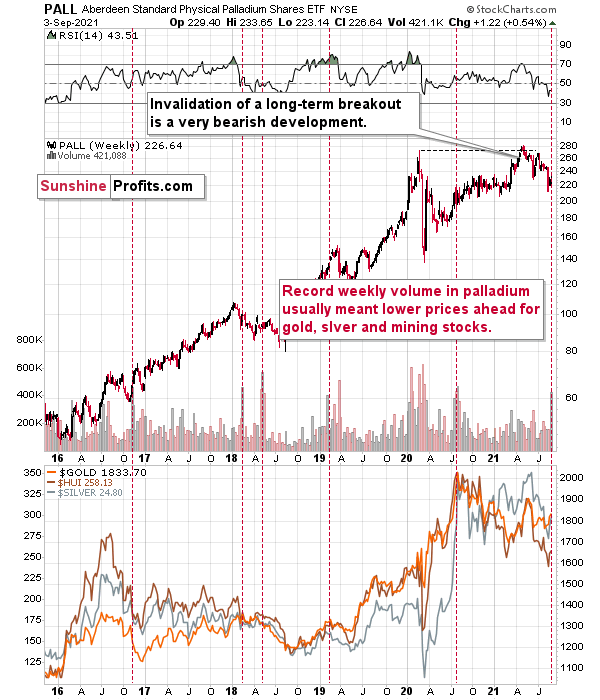
After all, gold did invalidate its long-term breakout above the 2011 highs, and the way gold reacted to a small upswing in the USD Index was truly profound…
Also adding credibility to the conclusions drawn from the volume spikes in the GDX ETF and the GDXJ ETF, last week, the Aberdeen Standard Physical Palladium Shares (PALL) ETF recorded a new 2021 high for weekly volume. And with abnormal volume offering a window into investor sentiment, historical euphoria preceded minor-to-massive declines in gold and silver (the red vertical dashed lines below). As a result, several areas of the precious metals market are sounding the alarm.
Last week’s volume spike was an anomaly, and whenever we see one on a given market, it’s useful to check what happened when we saw it previously. At times, you can notice some regularities – a pattern. And such a pattern could have important trading implications. That’s the case with palladium volume spikes, which – while rather inconsequential for palladium itself – were practically always followed by lower gold, silver, and mining stock prices. The implications for the said markets for the following weeks are thus bearish.
Thank you for reading our free analysis today. Please note that the above is just a small fraction of what our subscribers enjoy on a daily basis. The latest issue of our Gold & Silver Trading Alerts includes multiple premium details such as the downside target for silver, gold, and mining stocks that could be reached in the next few weeks.