BTC, the mother of all speculation, down >30% in a month, faces a crucial test at the $30k mark...if the equities market continue to fall, it mostly will drag BTC with it.
....will this time end speculative exuberance ? Bitcoin Price Prediction: BTC/USD Trades Around $35,100 Level
ByAzeez MustaphaPRO INVESTOR
Updated: 22 January 2022 Bitcoin Price Prediction – January 22
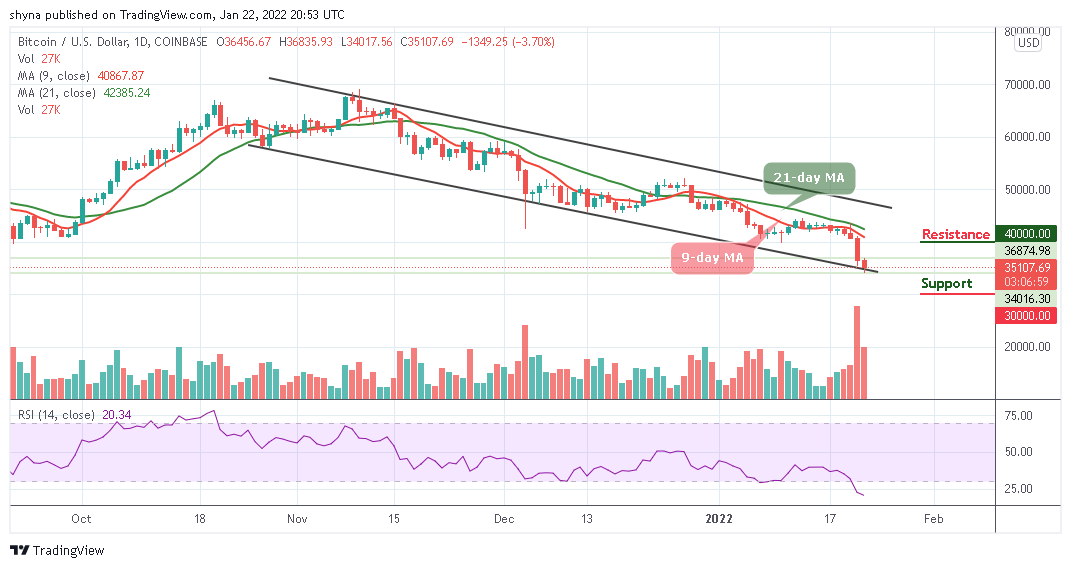
The Bitcoin price prediction shows that BTC continues to drop as the cryptocurrency breaks beneath $36,000 and heads toward $34,000. BTC/USD Long-term Trend: Bearish (Daily Chart)
BTC/USD is seen dropping with a loss of 3.70% as the cryptocurrency falls beneath the $36,000 level to reach the daily low at $34,017. However, the daily chart reveals that $38,000 is a very important level as it could provide a strong resistance for the coin. Bitcoin Price Prediction: Bitcoin Price Could Fall More
The Bitcoin price is currently trading around the lower boundary of the channel. However, a break below this trend line could cause Bitcoin to touch the support of $34,000 level. However, the king coin is in a critical position with the next few hours dictating the direction that it will head. A drop beneath this level could be detrimental to Bitcoin as it could lead the first digital asset towards the supports at $30,000, $28,000, and $26,000.
Moreover, if the buyers can rebound from the current support level at $35,107, the first level of resistance may come at $37,000. Above this, further resistance is expected at $38,000. This may likely follow by the potential resistance at $40,000, $42,000, and $44,000 levels. Presently, the Relative Strength Index (14) is within the oversold, indicating more bearish signals. BTC/USD Medium-Term Trend: Bearish (4H Chart)
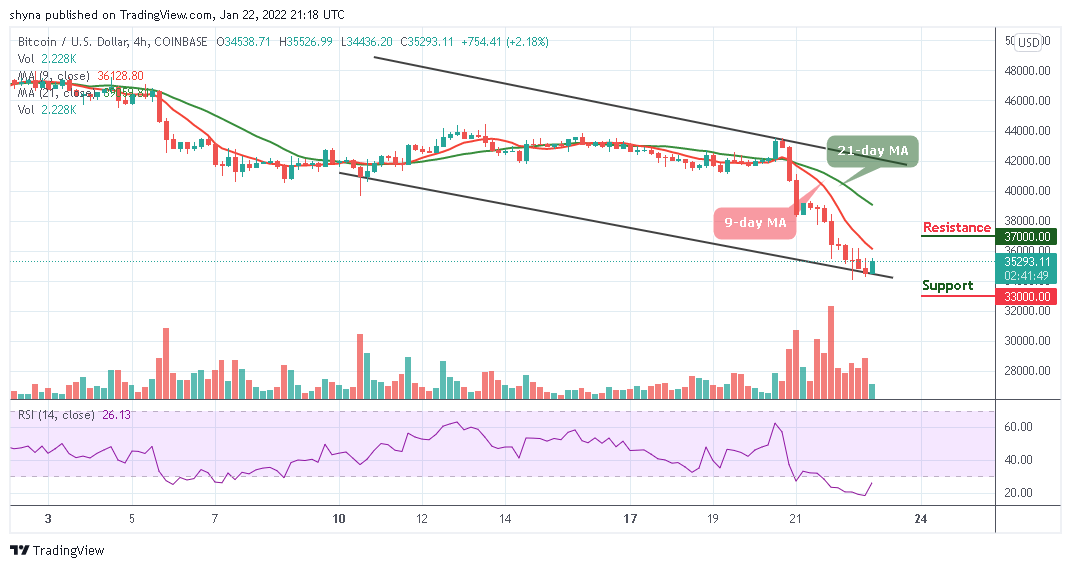
As reveals by the 4-hour chart, the Bitcoin price is seen hovering at $35,293 as the coin trades below the 9-day and 21-day moving averages with sellers forcing its price down to the daily low. However, if the bulls decide to push the market price above the 9-day moving average, the coin may likely hit the resistance at $37,000 and above.
BTCUSD – 4 Hour Chart
However, it now appears that the cryptocurrency is at risk of seeing further downside in the near term, as the attempt to drop below the lower boundary of the channel seems to indicate that bears are in control. More so, the Relative Strength Index (14) remains within the oversold and the coin may locate the critical support at $33,000 and below.
PRO INVESTOR