The DJIA dropped 390 points while the S&P500 lost 1.22% to close at 2883. S&P500 is just 1.3% away from retesting the 2844 low close on 5 Aug (after the 720pt drop in the Dow) and break the uptrend channel from 1st April this year.
As I had feared, a large drop (720pts) as with other large drop, usually is not that once off nightmare and can manifest itself into further declines amidst initial bouts of continued optimism vs new found pessimism. IMO if this is not going to be a correction, we may see it end around the 2744 pts mark with strong support but that would be a further 4.8% decline from here. A correction defined as 10% would take the S&P500 down to around 2,723 which would be about 5.5%. There is a possibility that upon the threat of an imminent correction, we would get some statements coming out from the Fed or the administration to soothe the market but even then with injured participants, sentiment would remain fractured and fragile.
This below is an extract from Andre Gratian from marketturningpoints.com
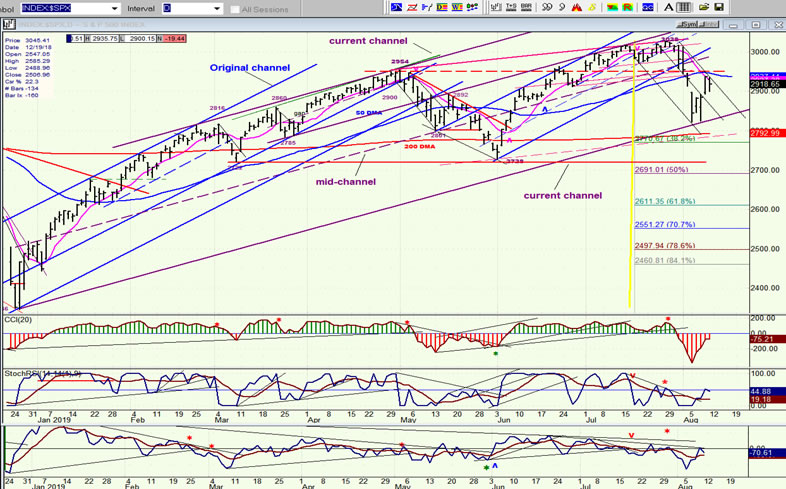
The decline from 3028 was sudden, engineered by two nearly simultaneous catalysts. It sliced through the small blue channel, the 50-dma, and came to rest on the bottom channel line of the larger channel, from which it staged a corrective rally back to just below the 50-dma. Considering that the rally also retraced a little more than 50% of last week’s downtrend, it is likely that this is merely a rally in a downtrend (more specifically the beginningof a downtrend) which is very close to ending and extending the initial decline to 2822 (2775 in the futures). It would be extremely unusual for the index to resume its long-term uptrend immediately after such a massive selling wave. At the very least, a re-test of the channel bottom should be expected and, more realistically, expectations should be for the channel line to fail to contain prices on the next decline.
The main rationale for continued weakness is that important cycle lows are still ahead, at least until about mid-September. Also, market leaders such as TRAN, IWM and XBD have all given weekly sell signals. SPX cannot be said to have done so conclusively, but it would be expected to follow the former and not resist their lead. The index did give a strong daily sell signal which was not reversed by last week’s rebound. If my evaluation is correct, by the end of next week, the decline will have resumed. SPX hourly chart