..Radomski's prognosis for gold miners isn't good and while it could be argued that he has a self-interested short position, his analyses to date has been more accurate than not.
..Nonetheless gold stocks are due for a upward recovery from oversold position, the question remains how it can break out from its present misery. A relatively better performed Gold has not helped to date. Neither has fear of a recession. If you recall, I posted that the XGD/XAU ratio below 2x was anything but healthy and in sharp contrast to its prior trading range of 2.8-3x even post-peak and now it is sitting at just 1.85x.
..Technically the XGD looks shot, and I am concern that given its prior history of an extended decline (from peak of 1 Dec 2010 of 8099 to trough of 1849 in 1 Nov 2013, it registered a 77% decline (see All view chart below); Gold lost 11.4% during the same period and XAU declined 14.95% during that period), that we should not discount altogether a possible similar period of extended decline.
..This now is beyond calling that Gold Equities is not Gold, which I had repeated expressed here. It is highlighting that Gold miners sharp disconnect with physical Gold to date isn't necessarily to be interpreted as entirely irrational (as much as it does appear to be so) but that it has done it before and the disconnect could well get even larger and more so if Gold does not break out to the upside (as we noticed it is now on the backfoot from a $1800 violation).
The irony is that most of us had sought sanctuary in gold miners because we felt that Gold would prosper and be in the position to benefit from an equity meltdown. Except that as also in the case of BTC, they instead have contributed more pain than general equity itself and both look to be in greater dire straits at this point, even before a possible bout of collateral damage.
It is another case of why Buy and Hold staying married to a philosophical/ideological perspective on an asset class is not an optimal approach, we should instead be taking advantage of the best side of the trade and avoid being taken down in its worst side. Buy and Hold could end up carrying it for several years to see almost zero returns. (As you can see on the All view chart of XAU, if one had bought in the midpoint of the 2000-2011 bull rally at say 1 Jan 2010 at 1081 and not got out in Aug 2011 high of 1826 for a 69% return, and continue to hold, it went down all the way to 1116 by 1 Jan 2016, six years later for a paltry return of 3%
-of course Gold suffered a Bear market from 2012-16).
If not for the war, there would’ve probably been a repeat of the 2008 gold market. However, there is something similar: the bearish outlook for miners.
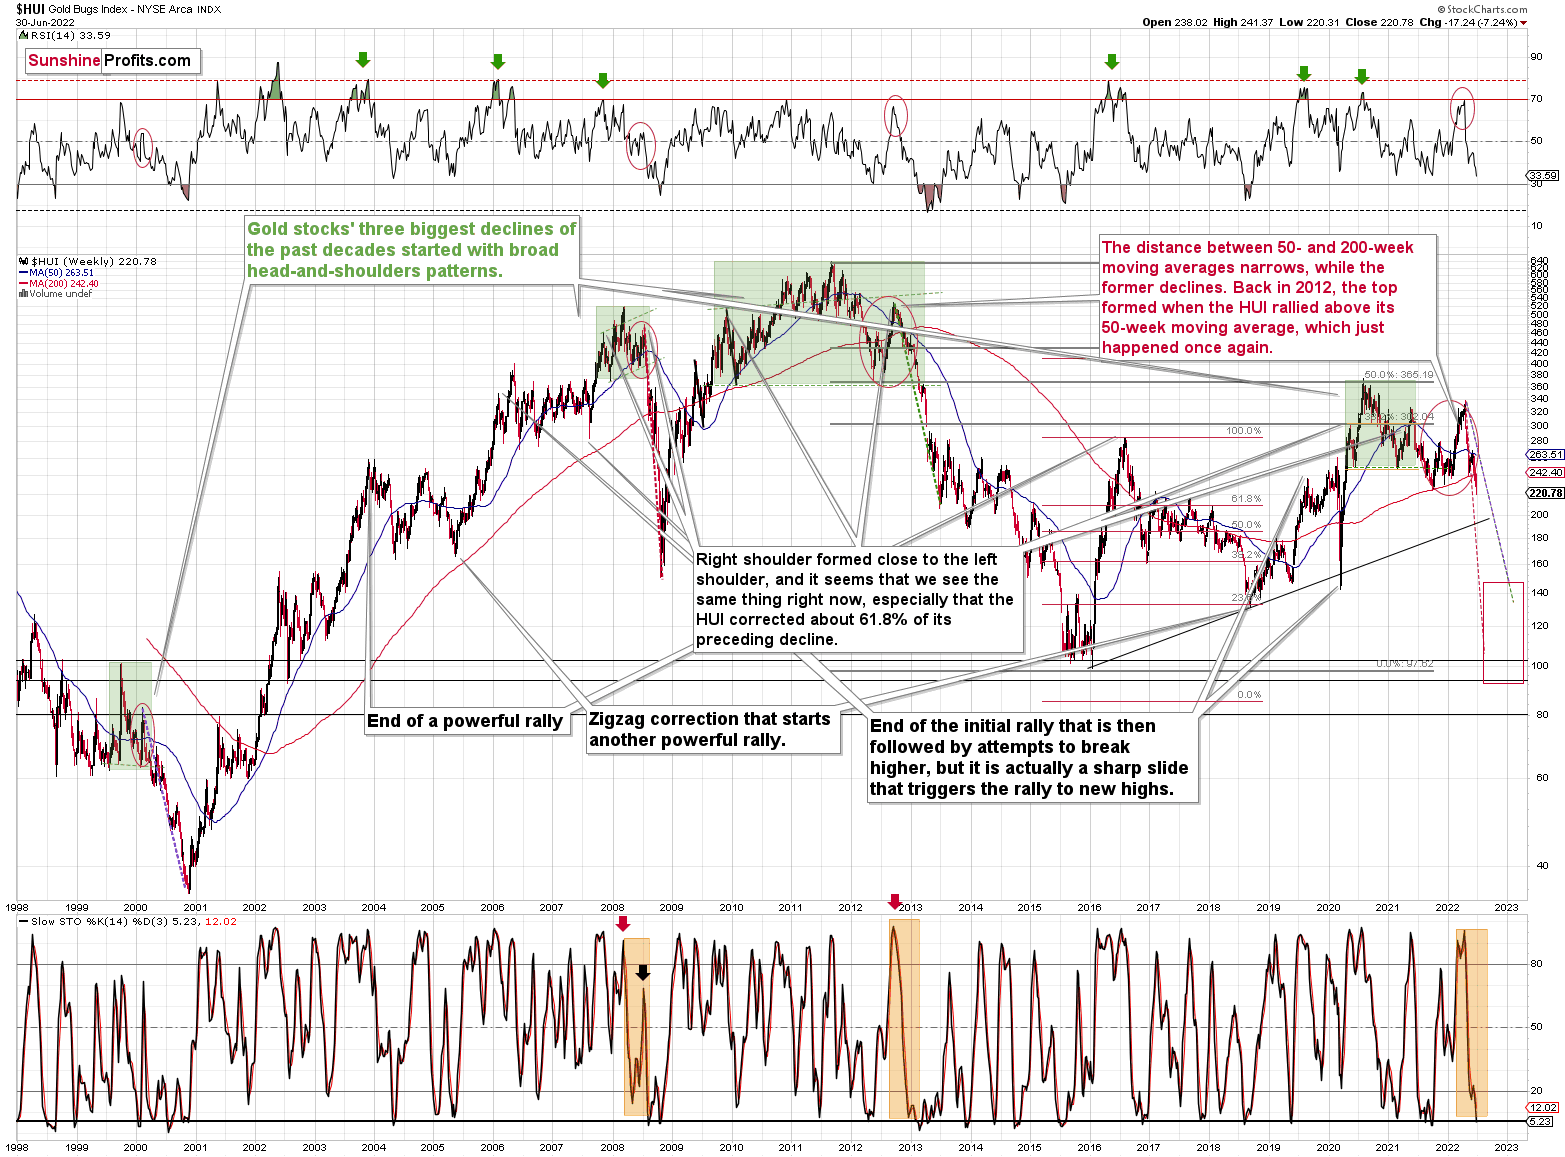
Gold stocks are declining similarly to how they did in 2008. (Click on image to enlarge)
The Russian invasion triggered a rally, which was already more than erased, and if it wasn’t for it, the self-similarity would be very clear (note the head-and-shoulders patterns marked with green). Since the latter happened, it’s not as clear, but it seems that it’s still present. At least that’s what the pace of the current decline suggests.
I used a red dashed line to represent the 2008 decline, and I copied it to the current situation. They are very similar. We even saw a corrective upswing from more or less the 200-week moving average (red line), just like what happened in 2008. We saw a breakdown to new short-term lows, which means that the volatile part of the slide is likely already underway.
Today’s decline in silver prices to new yearly lows definitely supports the above.
All right, let’s zoom in and see how mining stocks declined in 2008. (Click on image to enlarge)
Back then, the GDXJ ETF was not yet trading, so I’m using the GDX ETF as a short-term proxy here.
The decline took about 3 months, and it erased about 70% of the miners’ value. The biggest part of the decline happened in the final month, though.
However, the really interesting thing about that decline – that might also be very useful this time – is that there were five very short-term declines that took the GDX about 30% lower.
I marked those declines with red rectangles. After that, a corrective upswing started. During those corrective upswings, the GDX rallied by 14.8-41.6%. The biggest corrective upswing (where GDX rallied by 41.6%) was triggered by a huge rally in gold, and since I don’t expect to see anything similar this year, it could be the case that this correction size is an outlier. Not paying attention to the outlier, we get corrections of between 14.8% and 25.1%.
The interesting thing was that each corrective upswing was shorter (faster) than the preceding one.
The first one took 12 trading days. The second one took seven trading days. The third one took 2 trading days, and the fourth and final one took just 1 trading day.
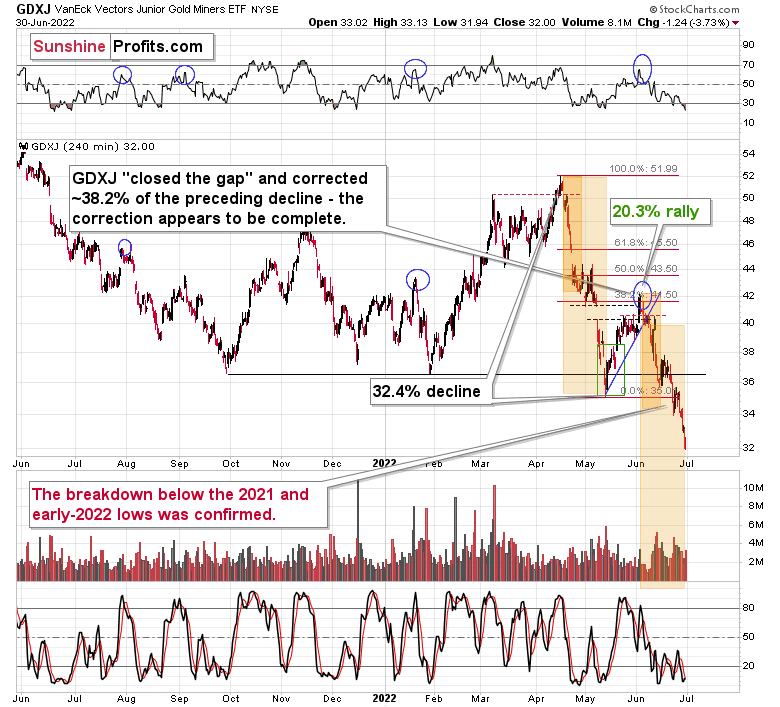
Fast forward to the current situation. Let’s take a look at the GDXJ ETF.
(Click on image to enlarge) The GDXJ ETF declined by 32.4% and then corrected – it rallied by about 20.3%. The corrective upswing took 14 trading days.
The above is in perfect tune with the previous patterns seen in the GDX during the 2008 slide.
What does it tell us? It indicates that history can be rhymed, and while it will not be identical, we should pay attention to the indicators that worked in 2008. The next corrective upswing (a notable one, that is) might start when the GDXJ ETF declines by about 29-35% from its recent top. To clarify, I don’t claim that the above technique would be able to detect all corrective upswings, or that I aim to trade all of them. For instance, in my view, it was a good idea to enter a long position on May 12 and switch to a short position on May 26, but I wasn’t aiming to catch the intraday moves.
GDXJ could also decline a bit more than 29-35%, as let’s keep in mind that previous statistics are based on the GDX ETF and we are discussing the GDXJ here, and the latter is likely to decline even more than GDX as juniors are more correlated with the general stock market (and the latter is likely to slide).
So, let’s say that the GDXJ might decline between 29% and 40% from the recent high before triggering another notable corrective upswing (one that could take between 5 and 10 trading days based on how long the last one took and how big those corrections were in 2008).
The recent high was formed with the GDXJ ETF at $42.19. Applying the above-mentioned percentages to this price provides us with $24.78-29.32. And yes, the above would be likely to take place along with a big decline in gold prices.
Now, is there any meaningful support level in this area that could stop the decline?
Yes! (Click on image to enlarge)
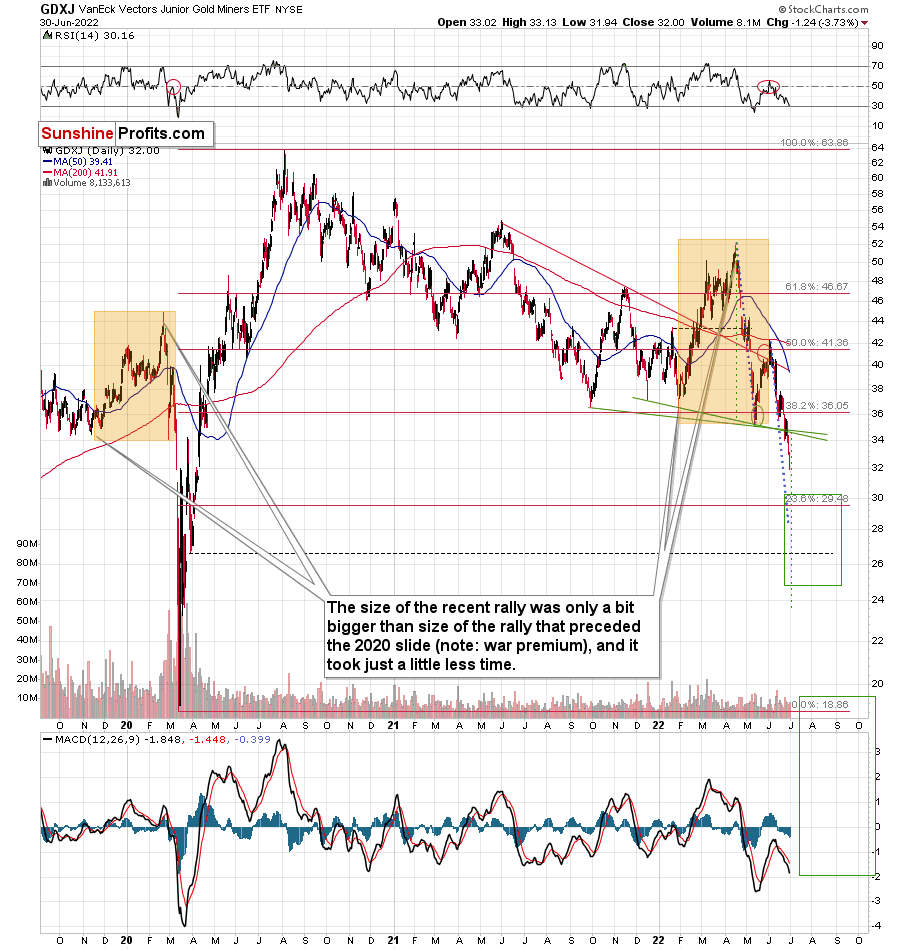
The late-March 2020 low is at $26.62, and it provides significant short-term support within the analogy-based target area.
Additionally, the above correspond – more or less – to the size of the decline that would match the size of the April-May decline. It would be only somewhat bigger.
Let’s keep in mind that gold stocks don’t necessarily move on their own, but rather move along with gold. So, if gold moves to its strong medium-term support provided by the 2021 lows and then starts a brief rally, the same action would be likely in mining stocks.
The head and shoulders pattern confirms that the downside target is well below $30, perhaps even as low as ~$24.
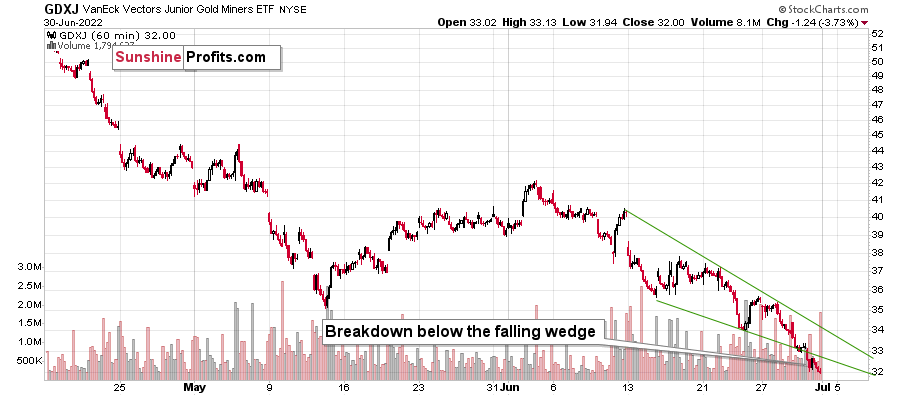
There’s also an additional detail present on GDXJ’s very short-term chart.
(Click on image to enlarge)
The GDXJ just broke below the declining wedge. While falling wedges are usually a bullish sign, they only become such after a break to the upside. What we witnessed was a relatively uncommon occurrence: a breakdown on the downside. The implications are therefore bearish instead of bullish, and the profit potential for the current short position remains enormous.