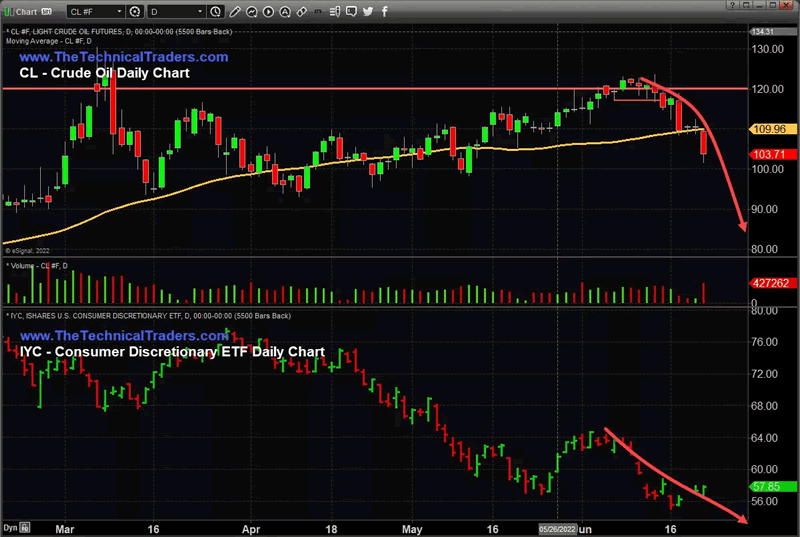
The recent downward Crude Oil trend may have caught many traders by surprise. Just before the US Fed raised interest rates on June 15, 2022, Crude oil was trading above $120ppb. Less than 5 days later, it collapsed -12% and has continued to trend lower. Currently, Crude Oil is near -17% lower than recent highs.
It appears Crude Oil has confirmed resistance near $120 and is devaluing as consumers pull away from traditional driving/spending habits while the Fed aggressively attempts to burst the inflation bubble. This type of contraction in Crude Oil is very similar to what happened in 2008-09 when the Global Financial Crisis (GFC) hit – Crude Oil collapsed more than -70% after IYC started trending lower in 2007.
Consumer Discretionary Spending May Be Leading Crude Oil Downward
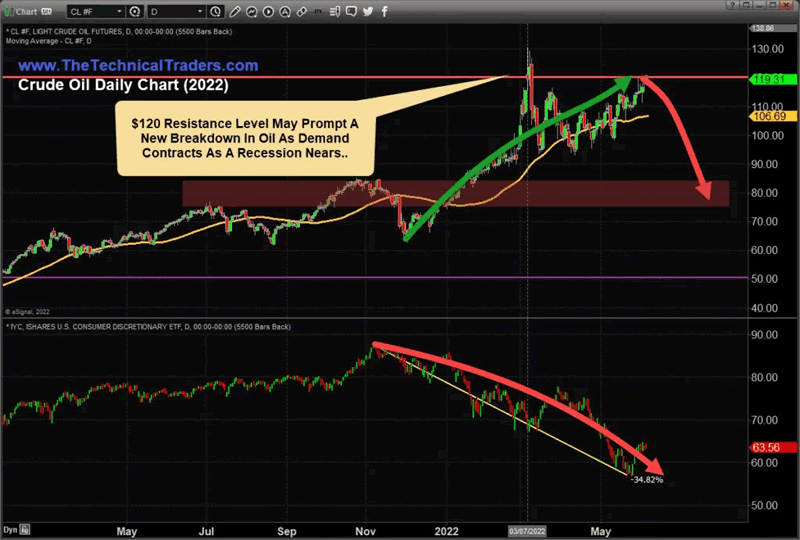
On June 9, 2022, I published a research article (CRUDE OIL PRICE AND CONSUMER SPENDING – HOW THEY ARE RELATED) highlighting the correlation between Crude Oil and the Consumer Discretionary ETF (IYC). In this article, I suggested any breakdown in IYC, below $60, may prompt a broad downward price trend in Crude Oil – possibly targeting the $75 to $85 price level.
Looking at this chart from our June 9, 2022 article, we can see IYC has already fallen more than -34% from recent highs. In 2007, peak oil prices were reached well before IYC declined more than -22%. So, in this case, the recent decline in IYC may already be predicting a downward price trend in Crude Oil – possibly targeting levels below $80 eventually.
(Our Crude Oil/IYC Chart from the June 9, 2022 article)
Aggressive Fed Action May Prompt Extreme Consumer Actions
In an oddly similar way, the 2008-09 GFC represented an extreme excess/speculative phase in the US Credit/Housing markets. Today, we see many similar facets after the COVID-19 event – where house prices skyrocketed from +25% to +45% in some areas. Additionally, prior to 2007-08, we saw moderately high inflation levels, Crude Oil was trading above $100 ppb, certain commodities were in very high demand, and consumers were spending aggressively on almost everything.
Today, we see a combination of some factors from the GFC as well as the DOT COM bubbles. Not only have house prices and raw commodities seen incredible rallies over the past 5+ years, but the Technology and Innovation sectors have also been leading market gains as well. Bitcoin rallied from under $1000 to a high of nearly $70,000 over the past 5+ years. The excessive speculation in the global markets recently is clearly evident in many various sectors and assets.
Global Central Banks Are Running The Show (Again)
I believe the US Federal Reserve will continue to raise rates aggressively in an attempt to tame inflationary trends. At the same time, we are likely to see many Global Central banks attempt to follow the US Fed in raising rates. This creates an economic environment many traders are unprepared for – an extended stagflation/recession period.
The downward trend in Crude Oil and IYC may be the “canary” for the global economy and what to expect going forward. When consumers pull away from traditional pending habits, we are likely to see a broad contraction in global GDP and other economic factors.
Traders and investors need to stay cautious of various global market trends and move back towards a more traditional method of managing their capital. The global markets are still 3x to 5x more volatile than at any time in recent history. Any aggressive trading style could lead to massive losses – as we are likely to see in many global Hedge Funds and managed accounts.
With the market environment and crude oil trend, it’s imperative to assess our trading plans, portfolio holdings, and cash reserves. Emotions can interfere with a trader’s success when they buck the trend (price). Remember, our ego aside, protecting our hard-earned capital is essential to our survival and success.
Successfully managing our drawdowns ensures our trading success. The larger the loss, the more difficult it will be to make up. Consider the following:
A loss of 10% requires an 11% gain to recover.
A 50% loss requires a 100% gain to recover.
A 60% loss requires an even more daunting 150% gain to simply break even.
Recovery time also varies significantly depending upon the magnitude of the drawdown:
A 10% drawdown can typically be recovered in weeks to a few months.
A 50% drawdown may take many years to recover.
Depending on a trader’s age, they may not have the time to wait nor the patience for a market recovery. Successful traders know it’s critical to keep drawdowns with reason, as most have learned this principle the hard way.