...interesting insights from the dot.com crash of 2000 experience - the Fed's rate cut did not re-invigorate a falling market as earnings decline (profit recession) took centre stage.
Anatomy Of A Bear Market: Even The Fed Can't Rescue Market If Earnings Tank
SUNDAY, JUL 03, 2022 - 12:30 AM By Nicholas Colas of DataTrek Research
If you were trading/investing from 2000 – 2002, today’s stock market action likely gave you a sense of déjà vu. It certainly did for us. The current bear market has taken as much out of the S&P 500 in 6 months as was the case in the first 12 months during the early 2000’s downturn. Also, recall that the Fed shifted to an aggressive easing stance in early 2001 and that did nothing to end the bear market because of uncertainty around corporate earnings, which fell by 32 pct. Bottom line: bear markets always end, but we remain cautious/defensive.
This week's disappointing equity price action got us thinking once again about the 2000 – 2002 bear market, and that is the subject of today’s “Markets” section. To be clear, we are not predicting US equities will lose half their value from the early January 2022 highs, as they did from peak to trough in the early 2000s. The point here is to understand the contours and narratives of a lengthy bear market, and for that there is no better case study in the modern era than 2000 – 2002.
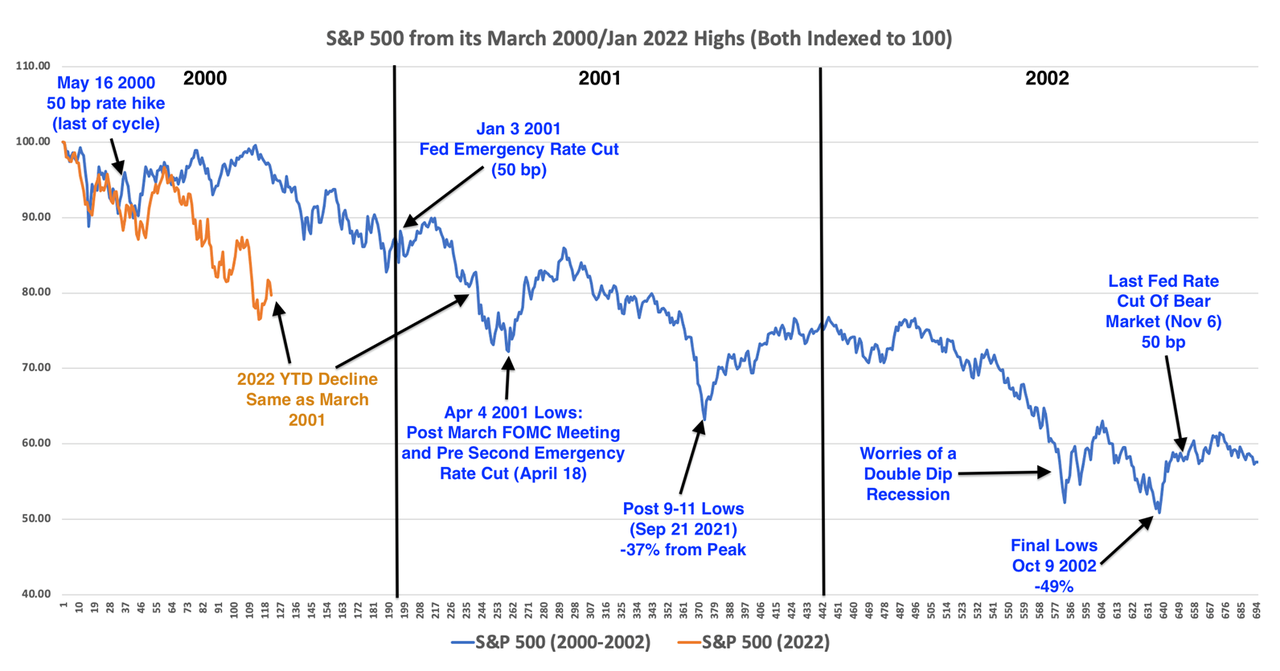
There is a chart at the end of this section with a comparison of the S&P 500’s price action from the March 2000 highs to the lows in October 2002 and the index’s price performance from the early January 2022 highs to today.
Here are 4 points we see in that data: #1: US large caps have declined much more quickly in 2022 than at the start of the early 2000s bear market:
At this point in 2000 (day 122 of that bear market), the S&P was only off 4 percent from its March highs.
As of today’s close, the index is off 20.3 percent from its January 2022 highs of 4,797.
If you were trading or investing in markets back in 2000, you know the reason for this difference: back then, it was the NASDAQ that first fell dramatically from its March 2000 highs. Investors cycled into more traditional names to play defense against the rout in tech shares. That put a temporary bid under the S&P 500. Some of the same thing happened earlier this year, but its effect only lasted through Q1. The S&P ended the first quarter only down 5.6 percent on the year. Since then the selloff has been much more widespread, as would be the case later in the 2000 – 2002 bear market.
Takeaway: the S&P 500 of 2022 is running the 2000 – 2002 bear market playbook at an accelerated rate. It took the index a year to drop by 20 percent in 2000 – 2001, and we’ve done that in 6 months this time now. A combination of geopolitical issues and their effect on oil prices as well as Fed rate policy are the central reasons for this more precipitous decline.
#2: The 2000 – 2002 bear market had its start as the result of Federal Reserve monetary policy, but even when the Fed shifted its stance stocks continued to drop:
The Fed had been increasing interest rates since June 1999 by 25 basis points at 2 meetings that year and at the first 2 meetings in 2000. It then bumped rates by 50 basis points at the May 16th, 2000 meeting. This was the last rate hike of that tightening cycle.
Starting in early January 2001, the Fed began cutting rates aggressively. There was an unscheduled (“emergency” rate cut on January 3rd of 50 basis points, followed by another 50 bp reduction at the regularly scheduled January 31st meeting. The FOMC then went on to reduce rates by 50 basis points again at the March and May meetings, with another emergency cut on April 18th as well.
The second half of 2001 saw the Fed cut interest rates at every regularly scheduled meeting by 25 basis points, except for the October meeting where it reduced rates by 50 basis points. This was a follow-on step after the emergency cut of 50 bp on September 17th, just after the 9-11 terror attacks.
The last rate cut of the 2000 – 2002 bear market came on November 6th, 2002, another 50 basis points.
From May 2000 to November 2002, Fed Funds went from 6.5 percent to 1.25 percent.
Takeaway: the lesson for today is that a change in Fed policy alone is no guaranty of a stock market rally. Even as the Federal Reserve was busy reducing interest rates through the first 8 months of 2001, the S&P 500 fell by 14.1 percent. Moreover, 10-year Treasury yields fell throughout the entire 2000 – 2002 bear market. They peaked at 6.8 percent in January 2000 and troughed in October 2002 at 3.6 percent. As with Fed monetary policy, that was not enough to support equity valuations.
#3: Corporate earnings declined from 2000 – 2001 because of the March – November 2001 recession, and the bear market lows came AFTER the lows for earnings power:
S&P 500 earnings power on a quarterly basis peaked in Q2 2000 at $14.88/share, just after the March 2000 highs.
Quarterly earnings bottomed at $9.02/share in Q2 2001, 39 percent lower than the prior year peak.
Earnings had already recovered to $11.61/share in Q3 2002, 28 percent off the lows, before the S&P 500 made its bottom in October of that year.
Annualized S&P earnings power fell by 32 percent from peak to trough during 2000 – 2002, on the low side of the typical 25 – 50 percent decline in earnings power typical during a recession.
Takeaway: 2002 was a rare case when stocks ignored a very visible increase in earnings power after a recession since geopolitical risk remained an overhang in the year after the 9-11 terror attacks. As much as earnings drive stock prices, geopolitics – especially those centered on the Middle East and tied to oil-producing states – can trump those over long enough periods to matter to investors. The October 2002 lows occurred the same week as Congress’ approval for military action against Iraq, an odd catalyst for a bear market low, but it did have the effect of removing any uncertainty about the future course of American foreign policy. One secondary issue worth noting is that investors were growing concerned about a “double dip” recession in 2002.
#4: Wrapping up with 3 lessons for today’s market:
The chart below shows what investors are coming to realize about the 2022 bear market: short term rallies can and do occur. They can seem like turning points, even when they are not. Let’s be careful with the idea that a change in Fed monetary policy alone can mark a turning point for the direction of stocks. This was certainly not the case in 2001 because of rising uncertainty related to corporate earnings as recession took hold. Such is the case again now, with S&P earnings near their peak at present ($55/share) but there is little visibility about where they go in the second half of the year and into 2023 if Fed policy has the desired effect of cooling the US economy.
A confluence of events created the 2000 – 2002 bear market, and we are experiencing similar issues in 2022 at an accelerated pace and without the chance of any near-term support from the Federal Reserve. The logical response to that setup is to invest defensively and bide one’s time until there is more clarity.
rate cut on January 3rd of 50 basis points, followed by another 50 bp reduction at the regularly scheduled January 31st meeting. The FOMC then went on to reduce rates by 50 basis points again at the March and May meetings, with another emergency cut on April 18th as well.