Gold Price Update – Support Holds, Mixed Signals On The Chart
By Nick Cawley of DailyFX
Monday, July 4, 2022 5:59 AM EDT
Gold Price Update – Grinding Into Multi-Week Support
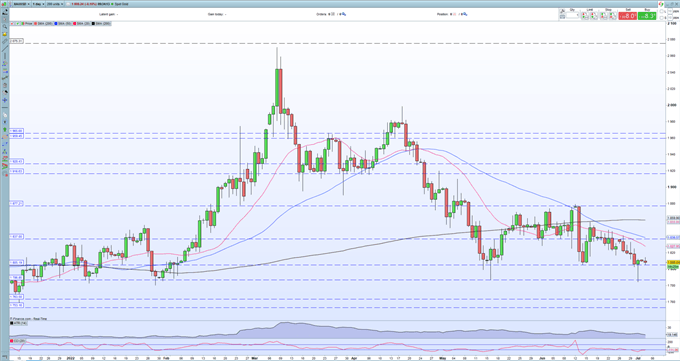
Gold tested a noted level of support at the end of last week but failed to break lower as US Treasury yields fell throughout the session. The support level is around $1,786/oz. – proved robust and the precious metal ended the session in positive territory, leaving a bullish hammer candlestick on the chart. This candle formation usually suggests a bullish turnaround, especially if preceded by a bearish trend.
The daily chart also shows a negative moving average crossover, a ‘death cross’ was made in the middle of June. This crossover, when the 5-day sma crosses below the 200-day sma, is often quoted by technical traders as a market negative as it shows short-term price momentum moving lower.
With the US closed today to celebrate Independence Day, turnover across all markets is likely to be limited. Gold looks set to trade within a $1,786/oz. to $1.840/oz. range in the short-term with US Treasury yields the likely driver of the next move. 10-year UST yields are now 60basis points below their recent high of 3.48%, as fears of a recession in the US increase. Financial markets are now pricing-in US rate cuts by the middle of 2023, easing the pressure on the precious metal. Before then, the Federal Reserve will continue to hike rates aggressively to counter soaring inflation, a negative for gold. For the time being, gold may well be setting up a trading range, a potential boon for traders.
Gold Daily Price Chart
(Click on image to enlarge)
Retail trader data show 84.56% of traders are net-long with the ratio of traders long to short at 5.47 to 1. The number of traders net-long is 1.34% higher than yesterday and 3.95% higher from last week, while the number of traders net-short is 9.57% higher than yesterday and 5.02% lower from last week.
We typically take a contrarian view to crowd sentiment, and the fact traders are net-long suggests Gold prices may continue to fall. Positioning is less net-long than yesterday but more net-long from last week. The combination of current sentiment and recent changes gives us a further mixed Gold trading bias.